[Previous]

I. Introduction

      Under the influence of deregulation of domestic air transport in the US in 1978 and the signing of the Single European Act in 1986, the European Council aimed to achieve an internal market in the air transport sector. The Council passed legislation under Article 84(2) to abolish the many existing bilateral restrictions on competition and to move from a bilateral to a multilateral system.


I.1 From the first to the third package of airline deregulation

      The Single European Act came into effect on 1 July 1987. The liberalization of air transport envisaged in the Act was begun, though it was done stage by stage because of the different positions which the member states took towards liberalization. Among these, the UK, the Netherlands and Eire were the foremost advocates of liberalization; Germany, France, Spain and Italy on the other hand, with their state owned and heavily subsidized national flag carriers, were at the rear. The process of liberalization was carried out in three stages; each stage usually termed the first, second and third packages, respectively. The first package was adopted by the Council in 1987, the second in 1990 and the third in June 1992.

      The first package contained regulations laying down the procedure for the application of competition rules to the air transport sector, as a result of which Articles 85 and 86 may be fully applied to all air transport within the Community. 1  The Commission was given powers to grant block exemptions for certain agreements between airlines on capacity and revenue sharing, non-binding tariff consultations and access to airport facilities. 2  A system was also introduced for the approval of air fares by member states which allowed for flexible pricing together with a relaxation of capacity controls between member states and freer market entry. 3 

      The second package included provisions for further relaxation of the requirement for fare approvals by national governments, allowing the designation of several carriers

      on certain routes and providing access to third, fourth and fifth freedom traffic rights on scheduled flights within the Community. In addition, quota sharing of passengers was progressively abolished. 4 

      The great leap forward took place on 23 June 1992 when the Council adopted three regulations which together form the third package. 5  The completion of the internal market was due to be completed at the same time as the third phase of the Commission's programme to liberalize air transport in the EC came into operation, with the result that airlines could no longer rely on government protection and had to adapt to the more competitive environment in which the rules of the market determine success or failure.

      The provisions of the third package meant first of all that free tariff-fixing was allowed from 1 January 1993 subject to certain safeguards to prevent excessively high or low fares. 6  Secondly, a Community-wide procedure for licensing carriers was introduced, which meant that any airline which met the specified requirements must be granted an operating license: 7  "The regulation on licensing is at first sight a regulatory measure ... However, its main importance is as a liberatory measure, because any airline which meets the specified requirements as to financial fitness, technical fitness and nationality of ownership and control, must be granted an operating license. In other words, member states are no longer allowed to continue the monopoly policies which they often previously operated in respect of national carriers: if an airline satisfies the basic requirements it must be granted a license by its home member state and then be allowed to operate to almost any destination within the Community"(Balfour 1994, p.1028). This regulation on access requires member states to allow any licensed Community carrier to operate between any two points within the Community. 8 

      As a third point, the remaining restrictions on cabotage, which applied during the transitional period starting on 1 January 1993, were removed from 1 April 1997. 9  With that measure, the Commission hopes that the many routes within the Community which are still served inefficiently or not at all will provide opportunities for new entrant airlines, as the prognosis for success is good because of the absence of competition on such routes. As this part of the third package would only take full effect in 1997, liberalization effects due to the lifting of cabotage restrictions are considered beyond the scope of this thesis.

      Although the third package may be considered successful in the sense that the number of airlines in the EC has increased between 1993 and 1997, this did not necessarily reflect in increased competitiveness on routes dominated by the big, established airlines: 94% of the routes within the Community were still mono- or duopolized in 1996 (Storm 1995, p.35). New entrant airlines have been forced to use a lot of resources just to stay in the market and the established airlines have not experienced the increase in competition they were expected to.


I.2 Three different schools of entry barriers

      This research intends to empirically show the linkage between the observed absence of competitiveness on European routes and barriers to entry, as they are specific to this industry. Barriers to entry and mobility explain important aspects of the strategic behaviour of industry incumbents. Any dynamic interpretation of incumbents' behaviour needs to take into account the underlying barriers in the specific industry.

      Barriers to entry and barriers to mobility have a long tradition in the domain of industrial organization. Bain (1956) defines as a barrier to entry anything that allows incumbent firms to earn surpranormal profits without the threat of entry. Stigler (1968) defines an entry barrier to be present when the potential entrants face costs greater than those incurred by a firm now incumbent in the industry. In contrast, Von Weizsäcker (1980) defines an entry barrier as an impediment to the flow of resources into the industry, arising as a result of socially excessive protection of incumbent firms. According to him, a barrier is an undefined object whose presence is to be judged only in terms of its undesirable consequences for social welfare. These three definitions of entry barriers can be characterized as three schools: the structuralist school (Bain), the Chicago school of efficiency (Stigler) and the normative school (Von Weizsäcker). 10 


The structuralist school

      Bain argues that the "condition of entry is determined...by the advantages of established sellers in an industry over potential sellers", with the comparison made between the pre-entry profits of established firms and the post-entry profits of entrants. Thus, a barrier to entry exists if an entrant cannot achieve the profit levels post-entry that the incumbent enjoyed prior to its arrival. Further, he argues that

      "...the condition of entry is...primarily a structural situation...[which] describes...the circumstances in which the potentiality of competition will or will not become actual" (Bain 1956, p. 3). He suggests three kinds of behaviour by incumbents in the face of an entry threat: blockaded entry, deterred entry and accommodated entry. He distinguishes between the fundamental structural conditions which create asymmetries between firms and the strategic behaviour of incumbents which exploit them. He argues that asymmetries in outcome ultimately (i.e. in the long run) rest on structural factors.


The Chicago school of efficiency

      Stigler's view of barriers contrasts with Bain's. He proposes that: "...a barrier to entry may be defined as a cost of producing (at some or every rate of output) which must be borne by firms which seek to enter an industry but is not borne by firms already in the industry" (Stigler 1968, p. 67). The primary conceptual difference between Stigler and Bain is that, in the former case, the entrant and incumbent are compared post-entry: a barrier exists if the two are not equally efficient after the costs of entering the industry are taken into account. Bain's emphasis on the conditions of entry assigns an entry barrier to any industry in which structural conditions exist that permit an established firm to elevate prices above the minimum average cost of potential entrants. Stigler considers an entry barrier to exist only if the conditions of entry are less difficult for established firms than for new entrants. Although Stigler's definition may appear somewhat ambiguous, in terms of measuring these barriers or when accounting for revenue-based, not cost-based, sources as barriers (i.e. product differentiation), his definition remains applicable in its broader generalized sense.

      The practical distinction between Bain and Stigler lies in the evaluation of economies of scale. Economies of scale, according to Bain, are barriers to entry due to the structural advantages they provide to the incumbent, whether the incumbent operates at minimum efficient scale or not. With Stigler, such economies do not present barriers if the incumbent is forced, after entry happens, to produce at suboptimal levels together with the entrant. Stigler attributes such cost disadvantages to new conditions in demand for the incumbent after entry, and not to the existence of particular barriers to entry.


The normative school

      Von Weizsäcker's concern is not with the factors that impede the mobility of capital, but rather with "socially undesirable limitations to entry of resources which are due to protection of resource owners already in the market" (Von Weizsäcker 1980, p. 13). His definition is a normative qualification of the definition proposed by Stigler: "...a cost of producing (at some or every rate of output) which must be borne by firms which seek to enter an industry but is not borne by firms already in the industry, and which implies a distortion in the use of economic resources from the social point of view." This definition implies that there could be too little entry due to excessive protection, as well as too much entry due to too little protection.

      With new entrants likely to create excess capacity, economic surplus would increase with increased costs of entry as well. In cases where entry costs increased total economic surplus, von Weizsäcker's definition of entry barriers would not apply. Demsetz (1982) has further extended this normative approach by arguing that, in many cases, what is called an entry barrier is an endogenous response to consumer preferences and supports an efficient allocation of resources. Rather than allowing resources into high profit industries, it might be better to take into account the role of externalities, information and transaction costs, and to consider entry barriers as a valuable second best answer to real world frictions.

      The major strength of this approach - its normative focus - is also the source of its major weakness. It is difficult enough to determine and measure barriers to entry without adding an additional layer of normative complexity. Normative issues can still be discussed after a barrier has been identified and measured.

      Returning to the focus of this thesis, we then ask: "Based upon our understanding of barriers to entry (and to mobility): What types of entry barriers can we identify and how do they apply to the airline industry? And what are the likely consequences, especially in terms of firms' strategic behaviour and pricing, of such barriers?" Ultimately, it was my intention in this thesis to develop a methodology that depicts the impact of entry barriers and strategic behaviour on the airline industry's choices in pricing and output following deregulation in Europe.

      Obviously, the concepts behind the different types of barriers to entry needed to be closely examined. I also had to understand the impact of these barriers for incumbents in terms of strategic behaviour and how this applied specifically to the examined industry. As studies advanced on the subject, it became clear that eminent economists had developed different models that partially contradicted each other - models that remained theoretic and were subject to many constraints. How could I apply such theory and its potential predictive power to the real world of airlines and their changed competitive environment? Being convinced that the concept of entry barriers was highly relevant for real-world industry analysis, I decided that one way to advance was to understand the industry and to find relatively detailed operational data for capacity and prices that were used in the economists' models.

      As my studies and research advanced, I became acquainted with the succinct theory of perfectly contestable markets. The more I learned about it, the more I realized its potential for my thesis. Contestability theory was intuitive and provided general predictions, especially in terms of pricing. There were few constraints to the theory, and the most important ones were exactly the ones I was out to test - entry barriers and strategic behaviour. In addition, significant studies based on this theory had already been conducted for the airline industry in the US. Somehow, it appeared that specific industry knowledge could be reconciled with the robustness of contestability theory. To prove the non-contestability of the European airline sector despite deregulation it was essential to find very specific and relatively detailed data for parameters that were suspected of raising entry costs and thus impacting on prices.


II. Economies of scale


II.1 Explaining the concept of economies of scale

      Economies of scale are based upon decreasing unit costs. The reason for such decreasing unit costs is amount of output, driven notably by plant size. Bigger plants can produce more and are better at exploiting mass-production techniques. They can also specialize labor to specific, narrowly defined tasks. Bain (1956) distinguishes decreasing unit costs in production from those in distribution, with each one being susceptible to specific changes depending on (physical) output. 11 

      The central question around this concept is: Do unit costs change, depending on size? As higher output allows for greater specialization (impossible at smaller scales due to indivisibilities) and for bargaining power, such decreasing unit costs are plausible. These economies lead to a local minimum, i.e. the minimum efficient scale of a plant. At this point, a plant operates at the lowest unit costs for a given technology, or with the optimal degree of specialization of labour. If this minimum efficient scale is important compared to the total capacity of an industry, Bain regards these scales as significant. One important qualification needs to be made: When increasing output beyond the point of minimum effcicient scale, diseconomies with growing unit costs may result. The logical process of economies with increasing scale simply reverses itself.

      Bain sees firms in industries adjust their size and the number of their plants to maximize their efficiency or minimize their cost per unit of production (Bain 1959, p. 146). Two assumptions are critical: (1) Firms are induced to seek maximal efficiency and (2) the degree of efficiency is systematically influenced by the size a firm attains. He distinguishes economies of scale due to large plants from those due to large firms (so-called economies of the multi-plant firm).

      In another qualifier, Bain points out that his concept is not directly relevant to appraising the actual efficiency of a plant. This is due to volatility in output over time. Varying degrees in capacity utilization alter the relation of actual long-run average cost to scale: As larger scale operations realize their maximum efficiency under steady operations at planned capacity, market volatility may give advantage to smaller scale and more adaptable operations. As a consequence, market uncertainty may alter the actual optimal size of a plant.

      Spence discusses how advertising expenditures interact with production costs to yield economies of scale. He sees advertising expenditures as fixed costs and asserts that "a certain amount of advertising is needed to counteract rivals' advertising, or to establish a market position..." (Spence 1980, p. 494). He argues that in an industry with differentiated products and advertising, it is the declining costs per dollar of revenues rather than declining production costs per unit of output that directly affect entry barriers and the profitability of established firms. Because advertising is designed to influence demand and therefore prices, it cannot be discussed entirely in terms of economies of scale or cost advantages in the normal sense. As demand and prices are affected by advertising, the relevant measure of scale economies, according to Spence, is to be found in the relation between the firm's revenues and its costs per dollar of revenue, rather than in the relation between costs and output as measured in physical units. With his model, he conceives a production function with revenues as output, and the inputs being the product in physical units and advertising expenditures. If this production function is characterized by increasing returns to scale, then a firm's cost per dollar of revenue generated will decline with growth in market share. It is quite possible to have diminishing returns to advertising alone, limited (or no) production economies, and considerable inherent differentiation, and still have overall economies of scale in the relevant sense. Just as in production theory, he sees that it is the sum of the response elasticities to the inputs that determines the extent of the returns to scale.


II.2 A model for limit pricing (Bain-Sylos-Modigliani)

      It is important to note that not only may economies of scale explain superior margins due to superior efficiencies in production, they may also work as deterrents to entry.

      The Bain-Sylos-Modigliani model of limit pricing depicts such deterrence (Tirole 1997, Sylos-Labini 1962): Economies of scale induce the incumbent to maintain output at the minimum efficient scale as the optimal reaction to new entry. High output around the minimum efficient scale of a firm allows for unit cost advantages compared with (smaller scale) entrants. These cost advantages act, of course, as a deterrent to smaller scale entrants (Bain 1956, p. 107).


Exhibit 1: Limit Pricing with economies of scale

      The dominant firm produces at output Xi which the entrant expects to be maintained by the incumbent if entry occurs. This implies that the entrant will face a residual demand curve, which is shifted to the right by the amount actually produced by the incumbent. The entrant cannot profitably enter, given the incumbent's output and his expectations that the incumbent will maintain this output even after entry: The market price PL is below the entrant's average cost at output Y, and there is no feasible level of output for the entrant where his average cost curve actually intersects with his residual demand curve. As a consequence for price policy, he concludes: The larger the percentage of the minimum efficient scale to total market capacity, and the more steeply unit costs decrease with changes to scale, the more long-run prices can be elevated above the least cost level without inducing entry.

      Bain's proposition was intuitively appealing in its original formulation, but it evoked a good deal of confusion about the expectations of potential entrants. Modigliani (1958) suggests that a useful assumption is that potential entrants expect existing firms to maintain their pre-entry output after entry occurs. If the entrants hold such expectations, then limit pricing deters entry since entrants would expect the post- entry price to be below their average cost. However, such expectations are irrational. Any potential entrant that did enter such an industry could immediately drive industry price below all firms' average costs since there are no entry or adjustment costs in these models. The more inelastic the demand, the stronger the dynamic, i.e. small additional outputs will drive prices down quickly. The existing firms would then incur losses by maintaining their outputs while, whereas if they had decreased their outputs, they could have earned profits (Flaherty 1980, p. 160).

      Flaherty's model lets a firm enter an established industry if and only if the potential entrant expects to be able to earn profits during the post-entry competition. The established firm's pre-entry output level is such that the entrant would have average unit costs exceeding market prices for a range of output rates between zero and some positive level of output. If the entrant were to increase capacity slowly, he would experience a period of negative cash flow before entering a period of positive cash flow. By purchasing a large plant, the entrant would shorten the duration of his negative profit period and thus increase his net present value. This means that the entrant would then be able to operate at the same minimum efficient scale as the incumbent, and there would be no point in maintaining output at pre-entry levels.

      Flaherty agrees with Bain in that greater increasing returns to scale will enable an incumbent to deter entry more effectively. With steeper slopes in the AC-curve, an incumbent firm could still deter entry, even by lowering its output. This would enable the dominant firm to maximize profits (by keeping prices high) while still deterring entry. For the entrant, this means that entry at large output levels (around minimum efficient scale) could be more advantageous than entry at small levels, although this is conditional on the slopes of the AC-curve.

      Scherer and Ross show that entrants who choose to enter at minimum efficient scale will depress the price, depending on the minimum efficient scale relative to the overall size of the market (other things, such as elasticity of demand, being equal). In an example, they assume unit elasticity and an minimum efficient scale of 10% of total quantity demanded. Then, as a consequence of entry at MES, prices will be depressed by 10%. Unless the pre-entry price exceeds the potential entrant's expected unit costs by more than 11%, entry will be unprofitable. In comparison, with a minimum efficient scale of 5%, existing firms can hold their price no higher than 5.25% above minimum unit cost without encouraging entry. In general, the smaller the minimum efficient scale is relative to the output volume demanded at a price equal to minimum unit cost, the less price can be held persistently above the competitive level without attracting new entry, ceteris paribus 12  (Scherer and Ross 1990, p. 378).

      This statement must be relevant for empirical observations: Only with steep falls in unit costs in the airline business and with significant minimum efficient scale, can economies of scale be found to matter for holding prices persistently above competitive levels.


II.3 Are there economies of scale in the airline sector?

      After the deregulation of the US airline market in 1978, the question whether or not this industry showed economies of scale was discussed in several economic papers, most of them examining the US context. The question was initially less relevant for new entrants, who might have been concerned about minimum efficient scale to be attained in order to be competitive with the incumbents. In reality, the economies-of-scale-argument was more often used by representatives from the major airlines when discussing route extensions and merger activities with the federal authorities.


II.3.1 General cost drivers in the industry

      Before examining some prominent economies in the industry in detail, I would like to provide a more general overview over the cost structure of the industry. This helps to situate possible economies of scale within the big picture of total costs of the industry or firm. In line with the remark already made by Spence on the role of advertising and economies of scale, I would like to show the possibility that within an industry or firm there are likely to be different sources for increasing returns to scale, which need not be aligned at all times. The introduction of several potentially important cost drivers in the industry will help to indicate such possible increasing returns, which may then be examined further on. This section will in large part be based on "An empirical study of cost drivers in the US airline industry" by Banker and Johnston (1993). The authors distinguish cost drivers that are volume based from those that are operations based. This distinction is noteworthy, seeing economies of scale (in the tradition of Bain, Spence et al.) as typically volume-based returns. Apparently, operations can also have significant influence on the firm's unit costs. Indeed, while Bain saw plant size as the key for achieving economies, operations can just as well lower unit costs to an extent that any new entrant who cannot employ the same operations without a cost will face a cost disadvantage.

      The following operations-based drivers represent choices of alternative technologies, as such choices of aircraft models, route structures, flight frequency or density, and traffic flow control. These drivers need to be regarded separately from scale-based drivers, which are based on the number of passengers transported or on the capacity of seat miles offered.

      When the examined cost drivers showed either increasing or decreasing returns, marginal costs would also change with these operations-based drivers. 13 

      
Exhibit 2: Cost drivers of airlines and their impact on unit costs 14 
Input category and measurement units Volume based drivers Operations based drivers
Fuel in gallons Capacity seat miles
by aircraft type (+)
Average stage length (-)
Flying operations, labour hours Capacity seat miles
by aircraft type (+)
Density (-)
Hub concentration (-)
Hub domination (-)
Passenger service, labour hours Capacity seat miles
by aircraft type (+)
Density (-)
Hub concentration (-)
Hub domination (-)
Maintenance, labour hours Capacity seat miles
by aircraft type (+)
Density (-)
Hub concentration (-)
Hub domination (-)
Scale (+)
Maintenance materials and overhead, deflated costs Capacity seat miles
by aircraft type (+)
Density (+)
Hub concentration (-)
Hub domination (-)
Aircraft and traffic servicing, labour hours Passengers (+) Density (+)
Hub concentration (-)
Hub domination (-)
Promotions and sales, labour hours Passengers (+) Density (+)
Hub concentration (-)
Hub domination (-)
General overhead, deflated costs Total capacity seat miles (+) Density (+)
Hub concentration (-)
Hub domination (-)
Scale (+)
Group property and equipment, deflated costs Total capacity seat miles (+) Density (-)
Hub concentration (+)
Hub domination (+)
Scale (+)

(source: Banker and Johnston 1993, p.#580)


  • The results for competitive and dominated hubs show large, significantly negative coefficients for labour that handles passengers, cargo and aircraft on the ground. Ground property and equipment and labour for flying operations are also significantly negative, and those for general overhead are significantly positive. Thus, by adopting a hub and spoke strategy, a carrier can achieve fairly substantial economies in the use of most inputs.
  • The coefficient estimate for average stage length is significantly negative for the fuel cost category. This lends support to the hypothesis that the marginal requirements for fuel inputs diminish as average stage length increases.
  • For promotions and sales labour, the coefficient for density is significantly positive, which indicates that adding flights on a given network requires additional support labour. The coefficient for passenger service labour is significantly negative. The coefficients for flying operations labour, maintenance labour, maintenance materials and overhead are insignificant. There are inherent difficulties in measuring capital inputs.
  • Comparisons among older aircraft, notably between larger and smaller planes, indicated highly significant differences in coefficients and are consistent with the hypothesis and industry evidence that wide-bodied aircraft require less fuel and flying operations input than older regular-bodied aircraft. However, sharp differences between older large aircraft and newer, slightly smaller models are not indicated. This suggests that the improvements in fuel efficiency and reductions in required crew size for the newer models have made up for the size-based advantages larger aircraft had in the past.

II.3.2 Economies of scale versus density


II.3.2.1 Defining the differences

      The question needs to be addressed of what is actually meant by "scale" in the airline industry. As we have seen, Banker and Johnston regard the number of passengers and capacity seat miles as scale, whereas density is an operations-driven variable.

      In a cost and factor productivity analysis of European flag carriers, Encaoua (1991) measures output in three ways: (1) Number of passengers, (2) Revenue-passenger kilometers (RPK), and available-ton kilometers (ATK). He sees an airline's scale dimension as mainly driven by stage length and traffic density. His proxy for density is simply the airline's load factor (RPK/ATK) on European routes compared to the North Atlantic ones. Scale to him is simply measured by the output measures number of passengers and revenue-passenger kilometers, while density depends completely on the average degree to which an airline loads its entire fleet for all European destinations compared with all North Atlantic routes. Unlike the other authors, Encaoua completely ignores factors such as network characteristics or technological arguments such as the relative efficiency of different aircraft sizes. He is interested more apparently in different factor costs within Europe and the factor productivity associated with them. By definition, whenever an airline achieves a higher load factor than competitors, ceteris paribus, output must have gone up as well. The extent to which a higher density will result in increasing, decreasing or constant returns can hardly be shown on such an aggregated basis.

      Other authors focus on technological aspects (such as aircraft size) or network characteristics (average departures per airport or hub-and-spoke service) to correlate their definitions of density with the slope of returns, while keeping average stage length and average load factor constant. Kirby (1986) measures an airline's output (as a scale dimension) in ton-miles-performed (TMP). He defines an identity relationship between TMP and five factors:

      TMP = PORTS * ADPP * ASL * AAS * ALF  15 

      It is important to note that Kirby employs variables - notably ADPP - that were already understood by Banker and Johnston to describe market density. Before Kirby, it was Caves, Christensen and Tretheway (1984), who showed that differences in scale per se have no role in explaining higher costs for small airlines. In order to make this clear, they distinguish in their model between returns to scale and what they call returns to density. To do so, they include two dimensions of airline size: the size of each carrier's service network and the magnitude of passenger and freight transportation services provided. They make this distinction between level of output and firm size, since "one might expect a lower level of unit costs if a given output were provided over a smaller number of cities" (p. 473). With returns to scale being accounted for separately from returns to density, definitions become somewhat more precise: Economies of density exist if unit costs decline as airlines add flights or seats on existing flights (through larger aircraft or denser seating configuration), with no change in average load factor, average stage length, or the number of airports served. 16  Scale economies exist if unit costs decline when an airline adds flights to an airport that it has not been serving and the additional flights cause no change in average load factor, average stage length or output per airport served (density). 17 


Exhibit 3: The underlying framework for analysing average unit costs


II.3.2.2 Introducing hubs and spokes

      In contrast to point-to-point routing, hub-and-spoke service allows airlines to concentrate traffic on key airports and to feed in from low-traffic airports. With the above framework in mind, the significance of hubbing now becomes clear: Hubbing allows smaller airports to be served with short-haul, smaller aircraft. Flight frequencies between airport legs can thus economically be increased; by definition, they need to be increased as passengers change at airport hubs instead of flying direct (variable ADPP goes up with hubbing). As a higher percentage of traffic is funnelled through key airports, connections between hubs may economically use larger wide-bodied, long-haul aircraft, which on other routes might not encounter the steady high demand required for economic service (variable AAS). We see that hubbing may be highly instrumental in increasing dense air traffic.

      Bailey, Graham and Kaplan (1991) focus on hub-and-spoke operations as the new network characteristics after deregulation in the US. They argue that such operations increase the average number of passengers per flight, letting the carrier take advantage of the economies of scale in bigger aircraft. Brueckner, Dyer and Spiller (1992) see the hub-and-spoke characteristics of an airline network as the basis for economies of density. Given such a hub-and-spoke network, network size (the number of city origins and destinations) and the size of the connected cities will increase density within such a system. By funnelling all passengers into a hub, such a system generates high traffic densities on its "spoke" routes. In another paper, Brueckner and Spiller (1994) understand the growth of networks to be an attempt to exploit economies of traffic density, under which the marginal cost of carrying an extra passenger on a non-stop route falls as traffic on the route rises (p. 380). In other words, network size as a scale dimension matters for density, but it is the hub-and-spoke characteristic that makes a given network size more densely employed.

      In contrast to the Caves, Christensen and Tretheway approach, Brueckner and Spiller consider details within the hub-and-spoke system that critically affect density levels. They quote the example that by holding the number of endpoints fixed, densities would fall as the number of hubs operated by the airlines increased, a network characteristic that was not accounted for by the Caves et al. model. The complex interdependence between scale and density in a hub-and-spoke network becomes clear in one of the paper's main conclusions: Entry into a particular city pair market (increasing scale) will usually be a network-wide decision (because it impacts on density in different spokes), rather than a decision based on the characteristics of the individual market (the city pair). This higher density then can be exploited by higher load factors or bigger, more efficient aircraft. Within a hub-and-spoke context, the researched economies of density were referred to as economies of spoke density (Berry, Carnall and Spiller 1996). 18  The exogenous variables of this model include distance between the endpoint cities and characteristics of the origin and destination airports. In this model, which does not account for the fixed cost effects of hubbing, only use of marginal costs is made.


Exhibit 4: Analysing marginal costs in a hub-and-spoke network


II.3.2.3 What brings down unit costs?

      Caves, Christensen and Tretheway (1984) develop a model of costs for airline services, with the intention of exploring the "apparent paradox of small air carriers with a purported unit cost disadvantage competing successfully against the large trunk carriers" (p. 472). The apparent contradiction regarding the trunk/local cost differential is explained by differences in the network characteristics between trunks and local service carriers. The average number of cities served by the locals is virtually the same as that of the trunks, but the density of traffic is much lower. The authors conclude that for both trunk and local carriers it is impossible to reject the hypothesis of constant returns to scale, but that the hypothesis of constant returns to density has to be rejected at each of the points observed (p. 479). They explain cost differences by the respective density of traffic within an airline's network. The average length of individual flights is also considered important. They grossly explain casually observed differences in unit costs for trunk airlines (7.7 cents per passenger mile in 1978) and for locals (11.2 cents) by lower density of service and shorter stage length for the locals (p. 483).

      Encaoua (1991) finds unit costs per passenger kilometrs to be lower on North Atlantic routes than on European ones. According to him, this result reflects the economies of scale due to greater distances and traffic density on North Atlantic routes. He measures unit costs, unit revenue, average distance and load factors computed for European and North Atlantic routes. The main reason for the lower unit costs on the North Atlantic routes (costs per available ton kilometre in Europe are two to three times those on North Atlantic routes) is seen as being linked to distance (p. 115). However, in 1986 unit costs also varied within European routes in a spread greater than 40% in 1986. The difference in average distance between carriers in Europe was not sufficient to explain such a difference. Variations in factor prices and factor productivity were considered part of the explanation. It was shown that the average load factor is categorically higher on North Atlantic routes than on European ones (p. 116). He sees this as a clear indication that density of traffic is more important outside Europe than inside Europe. For this reason, he argues, the most dynamic European carriers try to increase the size of their North Atlantic network despite the fact that competition on these routes is more severe. All his observations confirm that geographical and network configurations are sources of substantive variations in unit costs (and unit revenues) between European carriers.

      Brueckner, Dyer and Spiller (1992, p. 309) relate the fare paid by a four segment passenger, whose trip requires a change of planes at a hub airport, to the characteristics of the network in which he travels. With market specific variables, distance was found to be highly significant for lower fares (p. 325). The authors conclude that there is evidence for the importance of hub-and-spoke networks in reducing airline costs. In another paper, Brueckner and Spiller (1994, pp. 379) find that economies of density are strong during the sample period, even stronger than previous estimates by Caves et al., which were derived from traditional cost function methods. In their model, they determine the level of competition jointly along with fares. Their estimates of the desired cost functions are based on a structural model of airline behaviour. Brueckner and Spiller show that in 1985 the marginal cost of carrying an extra passenger in a high density network was 13%-25% below the cost in a medium or low density network, giving the high density carrier a distinct competitive advantage. It was shown that fares in a city pair market are low when traffic densities on the spokes connecting the market cities are high. It was also shown that longer trips had higher fares. Fares were also lower in markets with high tourism potential. As a main result, the elasticity of marginal cost with respect to spoke traffic was computed: Marginal cost falls by about 3.75% for every 10% increase in spoke traffic. This effect is stronger than the one estimated by Caves et al., which would correspond to a fall in marginal cost of about 2%. Brueckner and Spiller see the density effect as a causal factor leading to the emergence of dominated hubs. 19 

      They go on to explain that cost efficiencies of hubs may arise from the use of large, cost-effective aircraft on the densely trafficked spokes of a hub-and-spoke system. This relies in part on an engineering argument that larger planes are cheaper to fly regarding unit costs, at least on longer routes. For a given flight frequency, dense spokes can efficiently use larger aircraft. Economies of scale at the level of airline spokes in turn imply network economies, since hubbing airlines can combine passengers with different final destinations on a single large plane that flies to a hub city. At that hub the passengers switch to different planes, which carry passengers from various initial origins (Brueckner, Dyer and Spiller 1992).

      We have seen that Kirby (1986) finds substantial economies of operation with respect to load factors, aircraft size and stage length. In contrast, his model suggests diseconomies when an airline serves more ports and when it operates more flights from a given port. He assumes that such increasing costs related to market density probably arise from airside congestion at busier airports and congestion within the airport facilities. Kirby infers from this that cost advantages from dense markets "result largely from the ability to operate large aircraft at relatively high load factors, rather than merely from the opportunity to make more flights". 20  He goes on to forecast the impacts of different policies on total airline operating costs. In particular, halving the number of departures and doubling the size of the aircraft is estimated to lower operating costs most significantly (by 17.4% over a three year period).

      Depending on demand conditions, airlines may respond to increased density by increasing flight frequency rather than by increasing plane size (Berry, Crandall and Spiller 1996, p. 5). In their results, these authors find that congestion appears to raise segment marginal cost. According to their model, at distances less than 500 miles, marginal cost increases as density increases up to about 150,000 passengers per quarter and then begins to decline. At shorter distances this effect of finally decreasing marginal costs may not be seen, since the increased cruising efficiency of larger aircraft may not make up for their higher take-off and landing costs over these shorter distances. Increases in density in such cases would need to met with increases in frequency.

      Their model of airline competition captures two major features of the industry: product differentiation and economies of density. On the cost side, their paper presents evidence of economies of density on longer routes. However, economies of density may depend on the nature of the route. In particular, economies of density at distances less than 500 miles were not found. Consistent with the "Southwest Airlines effect", there was no evidence found concerning economies of density on shorter routes. According to these estimates, the "Southwest effect" may not be exclusively the result of lower labour costs, but rather may be the result of Southwest's having found a particularly effective cost niche.


II.3.3 Tracing cost curves for the airline industry


Exhibit 5: Cost relationships for the hub-density-aircraft complex

      The above graphical depiction provides a somewhat broad map of the relationships in the hub-density-aircraft complex. The signs (positive or negative) depict the expected relationships that empirical studies have found on marginal and average costs. In this section, I am trying to find a specific operations-based cost curve for the airline industry, which allows discussion of the trade-offs between increasing and decreasing returns and - it is hoped - identification of the shape of "minimum efficient density" in analogy to Bain's minimum efficient scale.

      As I have already pointed out, Caves, Christensen and Tretheway (1984) define returns to density as declining unit costs, with increasing numbers of passengers being transported between two points without any change in load factor occurring. Their parameters for declining unit costs (as well as marginal costs) are frequency of flights and size of aircraft (I chose to neglect the option of adding more seats to existing airplanes). Casually observed differences in unit costs for trunk airlines and for locals are largely explained by differences in characteristics of the firms, particularly by lower density of service and shorter stage lengths for the locals (p. 483). Thus, the following cost curve can be drawn:


Exhibit 6: A cost curve for the airline business (1)

      Encaoua (1991) identifies higher density solely with a higher load factor. He admits that the average load factor's impact on increasing, decreasing, or constant returns can hardly be shown on such an aggregated basis of overall airline operations. To him, what he calls geographical and network configurations are the source of variations in unit costs. He judges the aircraft type to be less relevant for such variations than average stage length. This statement per se does not contradict the above graph, though it lessens the significance of aircraft type for unit costs.

      Bailey, Graham and Kaplan (1991) focus on the returns of hub-and-spoke operations. Operating hub-and-spoke networks combines passengers with different origins and destinations - increasing the average number of passengers per flight and thereby reducing costs. Essentially the broader scope of operation lets the carrier take advantage of the economies of scale in aircraft (p. 74). The hubbing carrier would serve more passengers on its flights so it could use larger aircraft and/or higher load factors. This indeed is a classical argument of economies of scale: Larger, more efficient aircraft may offer lower unit cost if their capacity is sufficiently employed, just as a larger production plant may produce at lower average unit costs if its production volume is sufficiently close to its minimum efficient scale. This is highly relevant, because if Bailey et al. are right, then the key parameters of density would be nothing but simple economies of scale, similar in nature to Bain's concept of specialization. By funnelling traffic through a hub, hubs and spokes are instrumental in the exploitation of these economies of scale. Density together with hubs are a prerequisite for obtaining the minimum efficient scale, but would not be the origin of decreasing unit costs. Brueckner and Spiller (1994) build on this understanding of the density impacts of hubbing. They focus their research on marginal cost decreases when traffic on traffic spokes increases. They understand the growth of hub-and-spoke networks as an attempt to exploit economies of traffic density, according to which the marginal cost of carrying an extra passenger on a non-stop route falls as traffic on the route rises (p. 380). It is important to note that although they do not take into account the varying degrees of aircraft efficiency or load factors actually achieved, they nevertheless acknowledge their importance: " This higher density then can be exploited, analogously to Bailey, Graham and Kaplan (1991) by higher load factors or bigger, more efficient aircraft.


Exhibit 7: A cost curve for the airline business (2)

      If we understand hubbing and increased density as the means for exploiting economies of bigger and more efficient aircraft later on, then the marginal cost elasticities empirically tested by Brueckner and Spiller can be analogously applied not only to density on spokes but also to the associated parameters of aircraft type and average load factor. The following graph depicts this relationship:


Exhibit 8: A cost curve for the airline business (3)

      As a result, marginal cost falls by about 3.75% for every 10% increase in spoke traffic. The effect is stronger than the estimates by Caves, Christensen and Tretheway which would correspond to a fall in marginal cost of about 2%.

      In a follow-up study, Berry, Carnall and Spiller (1996) find no economies of density on shorter routes (less than 500 miles). In their model's specification, there are common costs across products because the same spoke can enter into the production of many demand side products. According to Banker and Johnston (1993), savings in marginal cost (av.$27) derive largely from concentrating flights through hubs. The savings associated with increasing average stage length are smaller (av.$2 per 1,000 capacity seat miles) and those associated with increasing density are the smallest (av.$1 per 1,000 capacity seat miles). Approximately 38% of the observations, however, exhibit net increases in costs with increases in density. The estimated net savings associated with all operations-based drivers average $33 and range from $10 to $132 per 1,000 capacity seat miles. If we were to aggregate effects in hubbing with those in density, decreasing marginal costs would seem to be confirmed.

      The question remains about the ambivalent effect of average stage length on average unit and occasionally observed increases in marginal costs. It is well documented that within the range of each aircraft, unit costs generally decrease with distance (Encaoua, Geroski and Jacquemin 1986), largely due to the character of planes as fixed costs and also due to the fixed cost character of take-off and landing fees. Banker and Johnston (1993) find this impact small, albeit favourable, when compared with the hubbing-density complex. Brueckner and Spiller (1994) even find increasing marginal cost with distance, according to their formula. 21  Decreasing marginal costs even at high densities could also not be found at short distances (Berry, Carnall and Spiller 1996). We conclude from this that the contribution of distance on decreasing marginal costs is small, and even strongly negative at distances below 500 miles, since it suffices to compensate otherwise strong economies of spoke density. This may also explain why Brueckner and Spiller had found a positive and slightly increasing relationship between overall marginal cost and the average distance in their sample.


Exhibit 9: A cost curve for the airline business (4)

      In order to find one general cost function for the airline sector, the counteracting slopes between density (aircraft, average load factor) and average stage length would need to be balanced and synthesized into one marginal cost curve. This can only be done by introducing a third axis (dimension) into our graph (for a three-dimensional graph, see Berry, Carnall and Spiller 1996, p. 41). Here, we choose to represent three marginal cost curves, each representing another stage length, in order to keep our cost curves in two dimensions. This representation also proved to correspond to the empirical values of table "Derivative of marginal cost with respect to density" 22  (p. 38).


Exhibit 10: A cost curve for the airline business (5)

      On the other side, costs that remain unaffected by a change of aircraft type are greater than those that depend on the type of aircraft (Encaoua 1991). Encaoua regards average load factor the key driver for increasing returns to scale, to be more important than average aircraft size. Beyond the obvious trade-off of either choosing a larger, more efficient plane or keeping a smaller one and increasing its load factor, other economies "ex aircraft" are identified. The fact that such other costs could represent a larger part than aircraft-based costs would not matter if their returns were constant. At this point, it may be helpful to go back to Banker and Johnston's (1993) empirical analysis of cost drivers. Now we are only interested in cost drivers for indirect airline costs, which are not determined by aircraft type. From their table with the hypothesized cost driver relationships, we retain the following:

      
Exhibit 11: Cost drivers outside the operation of aircraft that affect indirect costs
Input category and measurement units Volume-based drivers Operations-based drivers
Aircraft and traffic servicing, labour hours Passengers (+) Density (+)
Hub concentration (-)
Hub domination (-)
Promotions and sales, labour hours Passengers (+) Density (+)
Hub concentration (-)
Hub domination (-)
General overhead, deflated costs Total capacity seat miles (+) Density (+)
Hub concentration (-)
Hub domination (-)
Scale (+)
Group property and equipment, deflated costs Total capacity seat miles (+) Density (-)
Hub concentration (+)
Hub domination (+)
Scale (+)

      The results for the four categories above show significantly increasing returns to scale with respect to hubbing. These returns were even stronger when an airline dominated an hub. Levine (1987, p. 473) sees hubs as a means of reducing the time during which traffic builds to long-term levels, thus reducing the firm-specific non- recoverable entry costs (this would not affect marginal cost). He sees these and other lower incremental costs from hub operations as close to zero. Apparently, hubbing exhibits additional economies of scale, probably due to (organizational) centralization effects, which are independent of aircraft economies of scale. Congestion effects may be the most likely constraints to these increasing returns (Kirby 1986). These economies of scale due to centralization may be more pertinent than the possible efficiencies of density and bigger aircraft.


Exhibit 12: A cost curve for the airline business (6)

      Only by accounting for both effects - economies due to aircraft and due to hubbing - can one general average unit cost curve be found, which represents the minimum efficient scale for all major cost functions of an airline business. A clear understanding of which parts of density and hubbing are reflected in aircraft economies of scale and which in centralisation economies is key for the following integration of both effects. In short, an airline would tend towards its own minimum efficient scale by trying to organize hub-and-spoke operations and trying to dominate them, though avoiding congestion at the airport. At the same time, it would choose the most efficient aircraft to handle the increased traffic, probably wide-bodied long-haul carriers, to direct them at high load factors to other hubs for maximum economic gain.


Exhibit 13: A cost curve for the airline business (7)

      The above graph suggests the combined impact of economies of scale with wide-bodied, more efficient aircraft and economies of scale due to hub dominance. We assume more efficient, wide-bodied jets to be more expensive to buy than smaller ones. That's why AC2 is initially higher than AC1. At a higher load factor, the new aircraft's efficiency starts to show, where average unit costs become smaller compared with a narrow-bodied plane. However, the big plane's minimum efficient scale is achieved at higher capacity seat miles than with the small one. That is, a hub has to funnel consistently more passengers towards bigger planes serving its spokes in order to achieve its minimum efficient scale (or even to undercut average unit costs of smaller planes). With the risk of over-concentration at hubs, the risk of traffic congestion rises. In the case of traffic congestion, we assume marginal costs for bigger planes to be significantly above those for smaller ones. This explains why the slopes at high centralization of traffic at hubs are steeper for bigger, albeit efficient, planes. We expect the shape of average cost lines to hold for distances between 600 and 1,500 miles approximately, following empirical tests by Berry, Carnall and Spiller (1996). With greater distances, the differences between low and high density are probably more important. Below 600 miles, however, we expect both AC1 and AC2 to flatten out significantly.


II.3.4 Economies on European routes

      We are interested in locating European airlines on these depicted cost curves. In particular, we will try to determine if certain airlines appear to be operating closer to their minimum efficient scale than others. In order to do so, we need to look at the average stage length for city pairs of European carriers and at their respective flight concentration from and to their hub airports. The latter is a strong indicator for density, in the sense of having the opportunity to employ larger aircraft with higher load factors, and also indicating the potential to centralize operations at the hub.


II.3.4.1 Stage lengths of European routes

      The distance between European city pairs is known to be significantly shorter than, for example, most US routes.

      
Exhibit 14: Table of exemplary European city pairs and their distances
Departure city Arrival city Average distance
(in km)
Average distance
(in miles)
London Brussels 269 145
London Stockholm 1,942 1,048
London Athens 3,412 1,841
Frankfurt Lisbon 2,481 1,339
Frankfurt Barcelona 1,421 767
Frankfurt London 724 391
Paris Brussels 296 160
Paris Vienna 1,307 705
Paris Athens 3,009 1,624
Rome Frankfurt 1,314 709
Rome Amsterdam 1,771 956
Rome Milan 573 309
Madrid Milan 1,736 937
Madrid Athens 4,007 2,162
Madrid Lisbon 637 344

      Note: In air transportation, the use of nautical miles (1,852 meters) is common.

      A first look at the distances within Europe is already revealing. Three broad categories of city pair distances can be distinguished:

  1. Distances below 500 miles

      Here, marginal costs are expected to increase (with density) and average costs are relatively high. Five out of fifteen city pairs of Exhibit 14 fall into this category.

  1. Distances greater than 500 miles, but less than 1,500 miles

      Here, we expect constant or slightly decreasing marginal costs with increasing density and average costs to be located on a cost curve that is lower than the first category even though its slope is rather flat. Seven out of the fifteen routes in the table correspond to this category.

  1. Distances above 1,500 miles

      Only under these conditions can we expect marginal costs to decrease significantly with density and average costs to lie on a cost curve that obtains the lowest unit costs of all shown cost curves, provided that a critical degree of density (or hub concentration) is achieved. Only at average stage length above 1,500 miles would we expect relatively steep slopes for the convex average cost curve. Only here would we expect a distinct minimum efficient scale to be identified. Three out of fifteen city pairs in the table above fulfil these requisites.

      It has to be noted that only peripheral European routes, such as Madrid-Athens, Athens-London or Stockholm-Madrid, constitute such stage lengths. These routes traditionally have never been the most densely travelled ones in Europe. So, even if we expect such routes to be situated on lower average cost curves, these routes do not constitute the bulk of the airlines' network structure. They are the exception rather than the rule. In addition, density on such routes has traditionally not been the highest in Europe.

      This situation changes if the intercontinental routes of some European airlines are included in the picture. With average stage lengths to the US about nine times the typical stage lengths within Europe, carriers with such long-distance connections apparently have significantly lower unit costs with regard to their whole network than competitors who are constrained to purely European markets. This has been pointed out by Encaoua before. Only a few entrants in Europe offer such intercontinental connections, including Lauda Air and Virgin Atlantic.


Exhibit 15: A cost curve for the airline business (8)


II.3.4.2 Hub concentration at the origin or destination airport

      In order to account for both economies of scale stemming from larger aircraft (and higher load factors) and economies of scale from concentrating operations at a hub, we use the amount of capacity seat miles an airline generates from its principal airport as a suitable parameter to describe both potential economies. From different statistics, we can infer that only a few European airlines do indeed have such elevated numbers: British Airways at Heathrow, Lufthansa at Frankfurt and Air France at Charles de Gaulle.

      Following the logic of the above, these airlines should be located at significantly lower points on their respective average cost curves, that is, closer to their minimum efficient scale, if we assume that they can avoid diseconomies from airport congestion.


Exhibit 16: A cost curve for the airline business (9)

      The three shaded zones attempt to categorize European airlines according to their entry barriers with respect to economies of scale. Zone 1 depicts airlines that operate somewhere around the minimum efficient scale in the industry. Their unit costs are lower than those of their competitors because they serve longer distances and are able to exploit denser routes due to their hub-and-spoke structure. Airlines such as Lufthansa, British Airways and Air France might fit in here. Zone 2 consists of airlines that serve intercontinental routes - and might exploit the advantage of lower unit costs there - but do not have dominance on specific hubs. This means that their routes may tend to be less dense, and operating economies from centralization may be diminished as well. Airlines such as Lauda Air, Iberia, Virgin Atlantic and SAS may be located here. Former flag carriers, which still hold relatively the most airport slots but are not dominant anymore, would be located towards the lower part of Zone 2. Zone 3 shows airlines such as Ryanair, easyJet, Deutsche BA, and many others that do not serve intercontinental routes. The fact that they do not have any dominant positions at hub airports does not allow them to take advantage of the funnelling effect of hub-and-spoke operations. That is, they tend to serve their city pairs in a less dense manner. Theoretically, a fourth zone is conceivable: European airlines without any intercontinental routes, but with dominance at certain hubs. However, in reality, the only airlines that have obtained something like dominance on certain hubs are former flag carriers. All former flag carriers do have intercontinental routes in their network structure.


II.4 Implications for strategic behaviour

      The implications for strategic behaviour can be derived by analogy with what has already been said for dynamic limit pricing: Hub concentration determines the locus of minimum efficient scale and average stage length determines the slope of such an average cost curve. As a consequence, for the years following deregulation, incumbents should maintain their hub dominance or even grow it, if possible. They should concentrate more city pairs on their hubs (without congesting the hubs' infrastructure) to funnel in sufficient traffic for high-density hub-to-hub routes and try to increase the percentage of intercontinental, long-distance routes within their network system. These measures would then act as a deterrent to new entrants for given city pairs. If entry were to occur on certain city pairs, the incumbent would maintain his output on the particular spoke and cut prices below the entrant's average costs.

      But the entrant could also be tempted to enter not only on a single city pair but also network wide in order to duplicate the incumbent's efficiencies. Only with such large-scale entry could we expect incumbents to lower their outputs and to increase prices, in order to maximize profits. Such a significant scale would require dominance at a major airport. At the moment, there are several important European airports where incumbents dominate: Paris - Charles de Gaulle, London - Heathrow, and Frankfurt. With reference to Scherer and Ross (1990), such large-scale entry would lower prices significantly, if we assume unit elasticity for demand and incumbents maintaining output: If about 15% of an incumbent's traffic were to involve a hub, new entrants who entered the same hub at the same scale would roughly depress prices (for competing city pairs) by 15%. As a consequence, an entrant would prefer not to enter at such a scale, unless pre-entry price is more than 15% above the entrant's unit costs.

      If an entrant had the possibility to "buy" himself into airport dominance, he could shorten the period in which he would incur losses before making profits, due to the same average unit costs as the incumbent. However, these adjustment costs appear as infinitely high, since airport slots are only selectively marketed (Civil Aviation Authority 1998, pp. 47) and both construction and extensions of airports are highly limited. The increasing returns (steeper slopes for unit costs with higher density) due to international routes within an airline's network are equally difficult to obtain for new entrants. Virgin Atlantic was able to exploit British-American bilateral transatlantic agreements, as did Lauda Air on the Austrian side. These agreements, however, do not apply to other intra-European entrants to the industry. Again, adjustment costs for these unit cost advantages would be infinitely high, mostly for bilateral trade and legal reasons. These factors make it very unlikely that entrants could replicate an incumbent's AC-curve and obtain the same structural conditions for operating at the same minimum efficient scale as the incumbent. The incumbent would anticipate entry at particular city pairs and limit price below the average unit costs of entrants, while maintaining capacity on those spokes to deter entry.

      The question remains by how much the entrant is truly disadvantaged, given these factors, since entrants may exhibit firm-specific economies (for a comparison of actual unit costs, see Civil Aviation Authority 1998, p. 141).


II.5 Describing maintained output

      The major research question of this thesis is how entry barriers influence the pricing and output decisions of airlines. This chapter has examined economies of scale. Specifically applied to the airline industry, maintaining output because of economies of scale would be reflected in:

      Average aircraft size

      If the incumbent switched to smaller planes, we could hardly assume this would deter entrants in the sense of dynamic limit pricing.

      Average load factors

      These are not only dependent on the incumbent's choice of capacity but also on demand. Although smaller aircraft with higher load factors could provide the same output as bigger albeit less loaded aircraft, the signal to the entrant would not be one of deterrence, but of accommodation on a particular city pair.

      Average departures per airport

      Another way of making capacity choices, which has already been mentioned (Kirby 1986), is to change the number of average departures per airport. One would assume that increasing flight frequency would maintain output, even when using smaller planes. This last parameter, however, is negatively related to the industry- specific economies of scale as outlined above. Average departures per airport takes an average flight frequency among all airports in a network, thus neglecting the density effect of hubs. Even when looking at the flight frequencies originating or feeding into a hub airport, we confirm a negative relationship with average aircraft size: For a given demand between two cities, an airline could employ one big aircraft (say a Boeing 757) with one daily connection. If it were to increase flight frequency to twice a day, or even three times a day, the company would need to switch to smaller carriers (say Boeing 737s) to keep the plane reasonably loaded. The argument of economies due to centralization of services at a hub does not apply for the average departures per port parameter either. Why should unit costs for passenger service, maintenance, etc. be lower if the airline were to send two smaller aircraft instead of one bigger? In short, only if we see average aircraft size for given city pairs staying constant or even increasing, can we confirm entry deterrence after deregulation along the lines of dynamic limit pricing (with the incumbent to be understood to lower prices below the entrant's average costs).

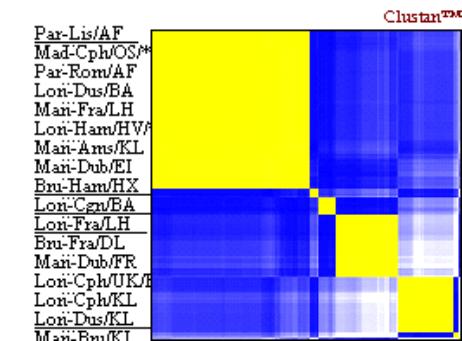
      The following exploratory scatterplot provides a first perspective on part of what is to be tested for statistical significance in the empirical part of this paper. After examining 178 different cases involving 35 heavily travelled city pairs served by several airlines, our scatterplot suggests that the vast majority of airlines did not follow our reasoning derived from dynamic limit pricing and applied to the airline industry: Airlines, especially incumbents, preferred smaller aircraft to larger ones, and the trade-off between flight frequency and aircraft size most often was resolved in favour of increasing frequency.


Exhibit 16(a): Aircraft size versus flight frequency (changes between 1993 and 1997)

      In the period between 1993 and 1997, we see that flight frequencies of airlines for given city pairs increased - more so when the use of smaller aircraft was maintained or seat capacity was only slightly increased. The cluster around Manchester -Brussels with KLM will be disregarded, since it depicts cases where traffic was shut down after deregulation. The fact that this cluster appears on the upper boundary of increasing aircraft size is due to the computations involving the sum of squared errors, etc. thus eliminating negative signs. Instead of finding an indication for an increasing (or even a vertical) slope between changes in frequency and aircraft size, which would have supported the hypothesis of exploiting economies of scale, we find a clearly decreasing, almost horizontal, slope. The scatterplot does not provide empirical (though only exploratory) support for the hypothesis of operating at minimum efficient scale through hub dominance either: The suggested tendency to increase frequency on short-distance European city pairs, rather than using larger aircraft, will hardly lower average unit costs.


III. Product differentiation


III.1 Definition

      Product differentiation advantages stem from buyer preferences for products or services. According to Chamberlin (1933), advertising, packaging, branding or auxiliary services can add to such differentiation. Product differentiation provides "independent jurisdiction" over price (Bain 1956). This jurisdiction implies an ability to raise price above that of rivals, while retaining some, but not all, of the customers who prefer the product. Correspondingly, a firm can lower its price without attracting away all of the competitors' buyers who prefer other firms' products.

      Bain (1959, p. 240) identifies three possible sources of product differentiation:

      A product differentiation barrier to entry would occur if its height remained the same regardless of the scale at which entry was made (ignoring the effects of sales promotion economies). Apart from price differences, product differentiation may result in other consequences as well:

      For an entrant, not being differentiated may be disadvantageous, taking the form of either lower prices or higher selling costs for the product. An entrant would then need to incur higher sales promotion costs per unit of output than the incumbent in order to sell at the same unit price. The sum of this lower price and the selling cost disadvantage will be the total disadvantage vis-à-vis a differentiated product. 23  In general, incumbents are assumed to possess inherently such customer preferences when compared with new entrants. As Bain states: "...a preference, transitory or permanent, for some or all established products as compared to new entrant products makes it unlikely, ceteris paribus, that entrants will be able to replicate post-entry the pre-entry price-cost margins enjoyed by incumbents without expending resources to develop their own consumer loyalties..."(1956, p. 114).

      In the field of transport, product differentiation among the services of competing carriers of the same type is present, but it is evidently more important in the field of passenger transport than in that of freight transport (Bain 1959, p. 221). Moreover, differentiation between products of established sellers and those of potential new entrant sellers ought to be distinguished. Customer preferences may have their specific distribution among incumbents and entrants (p. 237).


III.2 The issue of switching costs

      The key question for an entrant then must be: "How can I win over clients from established firms?" Evidently, to make reasonable choices among "experience goods" (those the consumer must consume in order to usefully evaluate them; Nelson 1970), the consumer must acquire information. However, these search costs are sunk costs, and so a prior investment with one particular brand will weaken consumer's interest in other new brands which arrive later on the market (Geroski, Gilbert and Jacquemin, p. 47). Thus entrants must persuade consumers already settled in their ways to collect information, compare products with different specifications and then re-evaluate their purchasing habits. Switching costs dissuade a consumer from changing brands - either because of the direct costs of switching or because of a distaste for sampling other brands. They are a source of diseconomies of scope in consumption because, with switching costs, a consumer is better off continuing to purchase from the original supplier even though another supplier offers the same product at a slightly lower price.


Exhibit 17: Demand with switching costs

(source: Geroski, Gilbert and Jacquemin, p. 48)

      A firm that sells Q units to customers each of which has a switching cost, f, has a demand curve as shown in the above graph. Ignoring possibilities for price discrimination, the firm has the choice of pricing high to exploit existing customers or pricing low to attract and lock in customers (prices Po versus Pn). Beyond the static aspect of switching costs, however, customer expectations of firms' behaviour are crucial. If customers of established firms believe that equilibrium prices will eventually be the same for all firms and that price changes will occur rapidly, they will chose to remain with their original suppliers even if switching costs are small.

      Based on the concept of switching costs, Farrell and Shapiro (1986) investigate an overlapping generations model of competition with no opportunity for price discrimination. In this model either the new supplier or the established one would act as a Stackelberg leader, and both firms have identical and constant marginal costs. They show a unique equilibrium in which the entrant serves only new customers at a price p and the established supplier serves only old customers at a price p+f. The incumbent would never compete for the new customers. Allowing for economies of scale, a customer base with switching costs can lead an established firm to allow entry even when entry prevention would be more efficient. They conclude that if economies of scale are not too great, keeping its established customer base while allowing for entry would be the best strategy.


III.3 Differentiation as a means for higher prices for incumbent airlines

      The most logical observation of substantial differentiation within European city pairs would be to examine one criterion: higher prices vis-à-vis an entrant. Such a pattern of price premiums paid for otherwise identical services closely reflects the rationale outlined by Farrel and Shapiro with their analysis of switching costs: The incumbent could choose to maintain his customer base and continue to charge a premium for its services vis-à-vis the entrant. The incumbent's market share would remain relatively stable (if the overall market did not grow because of new entrants) and a price premium over the entrant's price would persist. This strategy could be measured by the persistence of a price differential with entrants.

      A casual survey using different examples illustrates price premiums in favour of incumbents for the same ticket class (Civil Aviation Authority 1998, pp. 235).

      
Exhibit 18: A comparison of ticket fares (1)
Fare Type* Carrier Nov '92 Nov '94 Nov '96 Nov '97
Paris - Lisbon (FRF)
C2 TAP, Air France - 5,900 5,960 6,080
C2 Air Liberté - 5,900 4,900 -
Y2 Air France - 5,900 5,075 5,180
Y2 Air Liberté - 4,680 3,500 -
Lisbon - Paris (PTE)
C2 TAP, Air France - 156,000 151,500 151,000
C2 Air Liberté - 100,000 96,000 -
Y2 Air France - - 133,000 137,000
Y2 Air Liberté - 66,000 58,000 -
Vienna - Paris (ATS)
C2 Air France   11,880 11,180 11,180
C2 Austrian   11,880 - -
C2 Lauda   11,880 6,000 9,280
London - Milan (GBP)
CE3D Alitalia       428
CE3D Air One       349
* The C code stands for business class, Y represents economy class.

      This handful of examples suggests that indeed a significant price premium can be obtained by incumbents for otherwise identical tickets. 24  This first observation, regarding business and coach/economy class tickets, can be confirmed when looking at discount fares (from table I13, p. 237).

      
Exhibit 19: A comparison of ticket fares (2) - Lowest return fares of low-cost carriers (April 1998)
Low-cost carriers and routes Lowest return fare Example of lowest fare offered by national carrier
easyJet London (Luton) to GBP   GBP
Amsterdam 58 BA 67
Barcelona 78 BA 124
Nice 78 BA 128
Palma 98 British Midland 155
Debonair London (Luton) to GBP   GBP
Barcelona 99 BA 124
Düsseldorf 66 BA 98
Hamburg 130 BA 129
Madrid 109 BA 124
Munich 90 BA 117
Nice 99 BA 128
Debonair Düsseldorf to DEM   DEM
Barcelona 399 Lufthansa 499
Low-cost carriers and routes Lowest return fare Example of lowest fare offered by national carrier
Go London (Stansted) to GBP   GBP
Copenhagen 100 BA 122
Milan 100 BA 149
Rome 100 BA 149
Ryanair Dublin to IEP   IEP
London 49 - 59 Aer Lingus 76
Brussels 49 - 69 Aer Lingus 99
Paris (Beauvais) 79 Aer Lingus 99
Ryanair London (Stansted) to GBP   GBP
Oslo (Sandefjord) 89 BA 157
Stockholm (Nykoping) 89 BA 138
Virgin Express Brussels to BEF   BEF
London (Heathrow/ Gatwick) 3,200 Sabena 4,300
Milan 5,600 Sabena 7,120
Copenhagen 5,600 Sabena 7,140
Rome 5,600 Sabena 6,120
Madrid 5,600 Sabena 5,620
Barcelona 5,600 Sabena 5,620
Nice 5,600 Sabena 7,030

      Apparently, in all major price segments (business, economy and discount), some incumbents manage to maintain price premiums over the entrants. As we have no indication that the incumbents lose their customer base with such pricing behaviour (if exit occurs, it is the entrant rather than the incumbent that drops a route), we can find empirical support for post-entry equilibrium according to Farrel and Shapiro (1986). A closer examination of several factors that may contribute to such apparent barriers due to differentiation may further explain its underlying dynamics.


III.4 The means of differentiating airline services* 25 

      Why are passengers willing to pay more for otherwise identical tickets only because they come from an incumbent airline? Different aspects might explain such customer preference:


III.4.1 Active differentiation


III.4.1.1 Advertising

      Attempts to measure product differentiation barriers often start by equating barriers due to product differentiation with barriers due to advertising, at least partly because many scholars see advertising as the principal cause of product differentiation barriers. Comanor and Wilson (1967, p. 423) argue that advertising expenditures are "...both a symptom and a source of differentiation...". In practice, they used advertising-sales ratios and found significant positive correlations between advertising intensity and firm profitability.

      There are, however, a number of reasons for avoiding equating product differentiation with advertising and for thinking that advertising expenditures may be a fairly poor way to measure the height of barriers associated with product differentiation. The major objections arise because advertising is not a structural characteristic of markets. The basic structural determinants of the choice of advertising levels are consumer preferences, consumer informativeness, and the technology of production and of information transmission, and clearly, it is in these structural conditions that the source of product differentiation barriers lies (Geroski, Gilbert and Jacquemin 1990, p. 52). Hence, correlations between advertising intensity and firm profitability cannot necessarily be read as reflecting entry difficulties.

      Even if we were to accept advertising expenditures as the valid (and easily measurable) proxy for product differentiation, it would be net revenue effects, and not costs, that were the relevant quantity to measure the height of such differentiation barriers (Spence 1980). In the case of the airline business, due to price discrimination and rather general advertising campaigns, measuring such net revenue effects becomes difficult. Since price premiums for incumbents only exist on certain city pairs, over certain periods of times, in certain price classes, the allocation of general advertising expenditures to these sub-markets becomes virtually impossible. Deriving net revenue effects from these raw data would be impossible.

      Rather, we shall try to elaborate on several structural market characteristics, mostly in relation to differing customer preferences, which are at the root of successful advertising.


III.4.1.2 Brand loyalty

      The concept of brand loyalty has been the focus of widespread attention in marketing literature. However, a precise, generally accepted definition of brand loyalty is still lacking (Palda 1969, pp. 122-124; Engel, Kollat and Blackwell 1968, ch. 26; Walters and Paul 1970, pp. 507-510). Comanor and Wilson (1967, p. 425) summarize as follows: "...Because of buyer inertia and loyalty, more advertising messages per prospective customer must be applied to induce brand switching as compared with repeat buying...". It was widely assumed that continuous advertising expenditures would create such brand loyalty, which, in turn, would make it disproportionately expensive for entrants to match these expenditures in order to win over "loyal" customers (Schmalensee 1974, p. 579).

      Instead of discussing whether advertising is the only means of creating lasting brand loyalty, we shall make some other inferences: Brand loyalty appears to be similar to the switching cost disutility of consumers. Loyal customers tend to stick to their brand, even if prices are higher than for comparable products. If this were also the case for airline incumbents, why would they incur additional costs to develop an existing customer base? If incumbents' customers were already loyal, why would there be to create expensive frequent flyer programmes (the same rationale holds true for computer reservation systems and commission overrides for travel agencies)? Frequent flyer and similar programmes indicate a priori a lack rather than a surplus of customer loyalty, be it induced by advertising, superior service or other factors. Even accepting the hypothesis that frequent flyer programmes would actually create such loyalty, net earnings effects - not only price premiums over entrants - would need to be considered.

      We can deduce that net earnings effects can rarely be positive for discount tickets, for two main reasons: Passengers in these classes tend to be, by definition, more price sensitive and, thus, less loyal. If entrants offer lower prices in these classes, incumbents would need to compensate with enough "bonus miles". Taken together with the administration costs for frequent flyer programmes, net earnings in discount classes can hardly be higher than those of low-priced entrants. Even without taking into account the heightened price sensitivity of discount class passengers, we find that price premiums in absolute terms are regularly lower than with fully flexible economy or business class tickets, 26  mostly due to the lower base prices in these classes. The costs of administering frequent flyer programmes accounts do not alter between business, economy and discount. Sufficiently 27  high price premiums over entrants (in absolute terms) will realistically only be found with fully flexible economy or business class tickets.


III.4.1.3 Flight frequency 28 

      Flight frequency was considered in earlier sections as a measure of capacity choices. It was also discussed in the context of hub-and-spoke services. Offering more flights on given days than competitors may indeed differentiate services. It is obvious that frequency must benefit customers, provided flights take place at convenient times. Again, business class passengers (time is money) are expected to be more sensitive to such increased frequency than economy or discount passengers. Price premiums due to flight frequency should be more significant in business than economy class, simply because of higher opportunity costs in this customer segment. If entrants were able to offer the same frequency as incumbents on given city pairs, ceteris paribus, no price premiums favouring incumbents would then be justified.


III.4.1.4 Point to point

      In perfect analogy with what we have said about flight frequency, direct point-to-point connections should be preferable to spoke-hub-spoke connections. The increased customer utility of point-to-point flights holds even more true in Europe than in the US, because of regularly shorter distances between departure and final destinations. If entrants manage to provide such direct flights, and incumbents choose hub airports, it would be hard for the incumbent to justify price premiums. Again, business class passengers should be particularly responsive to such arguments, but possibly also economy and even discount passengers.


III.4.1.5 Service quality

      Service quality is intrinsically difficult to measure, or even to define adequately for the airline sector. Some reports refer to readily obtainable data, such as frequency, point-to-point connections or the use of jet aircraft (for example, General Accounting Office 1986, p. 3). Other aspects, such as frequent delays could be considered as quality issues as well. However, delays can only rarely be attributed to particular airlines; they are usually due to airport congestion. Other factors are more subjective, such as the friendliness and professionalism of the cabin crew. In terms of aircraft used, entrants widely use jets, as do the incumbents, thus no difference in quality can be derived from this. We shall thus assume that service quality between incumbents and entrants is equal, for a given ticket class.


III.4.1.6 Unique value propositions

      Price discrimination is usually linked to different classes of ticket. Associated with this type of price discrimination are corresponding value propositions. Business class tickets are more expensive than economy class tickets. On a more subtle level, economy class tickets can be subdivided into several classes of their own: Y, Y2, Pex, Superpex, etc. These tickets have different constraints tied to them: weekend stopover, fully flexible, non-refundable, two weeks in advance purchase, etc. It is pointless to try to find a source of differentiation vis-à-vis entrants in such tickets, if the entrant offers identical pricing schemes. The discrimination happens within the same airline, not towards other airlines.

      However, it is conceivable that incumbents might offer class categories that are not matched by entrants on specific city pairs. Price premiums then would be justified, although they would need to be compared to different value propositions from the entrants. Whenever incumbents are able to introduce such new value propositions, and to attribute a new class to them, differentiation occurs and price premiums become, theoretically, possible. If we assume that specific groups of ticket class (notably first, business and fully flexible economy) were offered by the incumbent on certain routes, without being matched by an entrant, significant price premiums could occur. These price premiums would exceed those premiums that exist solely due to price discrimination between an incumbent's fare classes.


Exhibit 20: Synopsis of operational factors that determine differentiation


III.4.2 Passive differentiation

      With active differentiation we sought to identify factors that might induce customers to pay premium prices due to their own preferences. We found that business passengers and economy passengers paying full economy fares are most likely to demand such services. But this demand driven approach is not necessarily what airlines, especially incumbents, tend to apply within their different flight classes. Exhibit 21 shows an example of price differentiation as exercised by an incumbent. It is noteworthy that a so-called Euro-budget fare (BB) is applied across all seasons, with a price level reflecting business class. This Euro-budget price is two and a half times the tariff of the lowest price offered on the same route by the same airline. For the designated economy fares, we identify clear price premiums for high season versus low season and shoulder season. It is however, arguable whether external factors, such as seasons, do really reflect customers preferences or rather present forces that leave passengers no other choice but to pay a price premium. We could argue that the passenger is still free to choose another season to fly with the same airline or to try to find a low-cost carrier with maybe less frequent flights, less service and perhaps more inconvenient flight connections. In addition, fully flexible tickets (designated by F) are sold with a premium over restricted tickets (R). 29  This premium appears to be significantly higher during high season compared with low or even shoulder season. Flights on weekends (W) are also valued at a slight premium when compared with those during the working week (X). We can observe price premiums in the economy class in the following order of significance:

      (1) season, (2) ticket flexibility and (3) weekend. For simplicity, we have grouped the incumbent's lowest fares in one single group (S). The different Super Saver fares are rather insensitive to season, but can differ between weekdays and (not considered in this study) flight number. The range of these lowest fares in the given example was between GBP93 and GBP104. It is equally noteworthy that fares during low season are already on a level comparable with Super Saver fares.


Exhibit 21: BA pricing for a European city pair in November 1997


III.4.2.1 Ticket classes indicating differentiation

      Beyond, for example, the frequency for a given city pair, the number of different flight classes offered may also indicate the airline's propensity to differentiate its services.

      Exhibit 22 lists the change in flight classes offered between 1993 and 1997 by the incumbents, other participating airlines or made by IATA for a selection of 32 city pairs in Europe. Exhibit 22 is a reduced version of a more comprehensive table that can be provided by the author upon request. Using the Official Airline Guide (1993 and 1997) as our source, we checked for the change in the number of ticket classes offered by the respective airlines or for changes in "official" fares (see column "NN"). These "official" fares can be considered default fares that apply in the absence of airline specific fares. Such fares are established in coordination with the International Air Transport Association (IATA). Darker shaded fields indicate the reduction of ticket classes by an airline or other entity (ticket classes reduced by at least two). Medium shaded fields show increases in ticket classes by at least two.


Exhibit 22: Increasing, decreasing and maintaining the variety of ticket classes

      The findings are relatively surprising. Of all the airlines, only BA (along with its partner British Midland) reinforces the use of ticket classes as a means to differentiate its fares. It is astonishing to see BA and BM increase their ticket classes to sometimes 15 or even 20 different classes for the same city pair. Among the other airlines, the important incumbents drop their airline specific classes altogether and seem to trust such differentiation - in the form of "official" airline independent rates - to a somewhat more collective body. These "official" fares regularly create between four and six new classes, with the total of classes offered the same. The exception may be Lufthansa, which maintains a relatively advanced degree of ticket differentiation for its Heathrow route.

      By examining this exhibit on the basis of city pairs served, we find indication that hubs induce the creation of new ticket classes (either by the hub's dominant airline or by introducing new "official" rates supposedly valid for all contenders). Indeed, these findings tend to underline the significance of hubbing even for differentiating airline services and not as usually written, solely for "economies of scale or density".


III.4.2.2 A survey of airlines' tendency towards passive differentiation

      With the above exhibit in mind, we now can focus on those airlines and city pairs that increased their ticket classes with respect to "official" rates between 1993 and 1997. Our intention in this survey is to identify the factors of differentiation used most for creating new ticket classes. With this iterative approach we hope to filter out the key factors for differentiation actually used, independently of the price premiums that they may incur. In the following exhibit we show all city pairs that increased the number of ticket classes for "official" fares and present a further disaggregation of these selected "official" fare classes as of June 1997.

      
Exhibit 23: "Official" ticket classes June 1997
  Types of classes  
City pair CY BB EE *PX*M HPX*M KPX*M LPX*M HSX*M LSX*M NN Total
Amsterdam - Frankfurt 2 1   1             4
Barcelona - Rome 2 1     1 1 1       6
Brussels - Frankfurt 2 1   1             4
Brussels - Hamburg 2 1   1             4
Madrid - Athens 2 1     1 1 1       6
Madrid - Copenhagen 2 1     1 1 1       6
Madrid - Lisbon 2 1     1 1 1     1 7
Madrid - Milan 2 1     1 1 1       6
Madrid - Rome 2 1     1 1 1     1 7
Paris - Athens 2   1         1 1   5
Paris - Barcelona 2   1 1             4
Paris - Lisbon 2     1             3
Paris - Madrid 2   1 1           1 5
Paris - Milan 2   1 1             4
Paris - Rome 2   1 1             4
Total 30 9 5 8 6 6 6 1 1 3 75

(Source: Official Airline Guide 1997)

      The various ticket classes divided into groups now reveal ticket classes in full - economy and business (Y and C, although the same prices are now charged for these services). A Euro-budget fare (BB) applies to many city pairs and is comparable to former business fares. Special Excursion fares (EE) exist on some southern routes linked to Paris. We are more interested in the fare structure in economy class. As expected, we find a distinction between high, low and shoulder season fares (H, K, L) but only on six city pairs - not on routes linked to Paris. Also, we find solely flexible tickets (PX and SX) in economy class. The "official" fares do not include either restricted fares or Super Savers. The least we can say about these newly created ticket fares is that they do not introduce "no-frills" or other low-priced ticket classes. Moreover, we cannot filter out factors of differentiation in the above sample (apart from seasons, perhaps, for the six city pairs mentioned).

      It may be that such factors are easier to identify from the city pairs with increased ticket classes served by BA and BD (see associated medium shaded areas for these airlines in exhibit 22). In exhibits 24 and 25 we further disaggregate the ticket classes offered by these airlines into their components and compare their changes between June 1993 and June 1997. For example, if BA offered a specific restricted ticket for flights on weekends during a shoulder season (IATA code: KWAP), we registered three elements for this single ticket: K (shoulder season), W (weekend) and R (restricted ticket). Also, special discounted fares appear: Excursions (E) and Super Savers (S). 30  All these elements were compared.

      
Exhibit 24: BA's changes in ticket features between June 1993 and June 1997
Route Class Season Week Flexibility Specials
  B C H K L X W F R E S
LON - CPN 0 0 0 0 0 0 0 0 0 0 0
LON - Cork 4 1 3 0 3 0 0 2 4 0 0
LON - DBN 0 0 0 0 0 0 0 0 0 0 0
LON - FRA 2 0 3 4 3 8 8 5 5 0 4
LON - BRU 1 0 2 4 2 8 6 2 6 0 4
LON - AMS 3 0 5 4 1 6 8 -1 11 0 4
Total 10 1 13 12 9 22 22 8 26 0 12

      For BA, we find true business class fares grouped under B (IATA code D2, D2RT or DBB, etc.). These business class tickets have significantly higher prices than all other ticket classes. We see that BA created 10 new ticket classes within this segment. In total 34 new ticket classes included differentiation according to season and 44 more tickets took account of the day of the week in 1997 than in 1993. In terms of ticket flexibility, 26 more restricted ticket fares existed in 1997 than in 1993, compared with only eight fully flexible tickets for the six city pairs selected. This indicates growing pressure from low-cost carriers, especially on the routes London-Frankfurt, London-Amsterdam and London-Brussels: 22 out of the 26 net increase in such tickets stem from these city pairs. This observation is underlined by the same development with Super Saver fares (S). BA chose to differentiate its ticket classes at both the high and low ends of the market, and the middle segment sees significant fares increases according to factors such as season, day of the week and flexibility. Each city pair is considered a separate market, as no global changes in these new fares become apparent that affect all city pairs the same.

      
Exhibit 25: BD's changes in ticket features between June 1993 and June 1997
Route Class Season Week Flexibility Specials
  B C H K L   B C H K L
LON - CPN 4 1 1 0 1 0 0 1 1 0 1
LON - Cork 0 0 0 0 0 0 0 0 0 0 0
LON - DBN 1 0 0 3 -1 1 1 0 0 0 3
LON - FRA 3 0 -1 3 1 4 4 3 -1 0 4
LON - BRU 2 0 -2 3 0 2 2 0 0 0 3
LON - AMS 2 0 -1 3 -3 1 1 4 -3 -3 2
Total 12 1 -3 12 -2 8 8 8 -3 -3 13

      Like BA, BD increased the number of business class fares. It reduced its excursion and restricted ticket fares on the route to Amsterdam, but increased Super Saver fares on most city pairs. BD made increasing use of shoulder fares, apparently to the detriment of high and low season fares. More differentiation as a function of the day of the week was applied on fares for four out of the six city pairs highlighted. Eight new fares involving fully flexible tickets were created, although they focused on the more densely travelled routes to Frankfurt and Amsterdam, two major European and international hubs. In comparison with patterns observed for BA, differences appear for restricted flights, where BD reduced the variety of such ticket classes by three (whereas BA increased his by twenty-six). Across all city pairs BD has reduced high and low season types of tickets whereas BA has increased them significantly. On a route-by-route comparison, differences appear for flights to Copenhagen, Dublin and Cork. For London-Copenhagen and London-Dublin BA did not change its fare structure but BD had undertaken such changes: To Copenhagen, four new business classes were introduced and small adaptations were made for seasons (H and L only), as well as for flexibility and super savers. For routes to Dublin served by BD, major changes were made on the lower side of the spectrum with three new Super Saver fares, as well as for seasons (three new shoulder season fares). Small adaptations were made on business class and on days of the week, but not on flexibility. For London-Cork it was BD that did not modify its offer of ticket classes.


III.5 When differentiation meets scale effects: lever or constraint?

      For Bain (1956, p. 118), product differentiation and economies of scale could go in different directions. It is possible that the scale that minimizes the product differentiation disadvantage is so small as to be sub-optimal from a production-distribution standpoint. When such a situation is encountered, the scale at which entry takes place is likely to be altered because of product differentiation disadvantages.

      Conversely, measures aimed to create or increase differentiation may at the same time exacerbate the effects of scale economies on the profitability of entry. When combined with a scale related barrier to entry, firms might find it profitable to enhance product differentiation in order to exploit the benefits of scale. Spence (1980, pp. 493) shows how advertising expenditures can influence the optimal scale of production by affecting both the cost of operation and the revenues that can be collected at a particular level of output. To Spence, it is not increasing returns in comparison to the physical volume alone that best measures such entry barriers. For differentiated products, it is the combination of three elasticities 31 , that determines the extent to which costs per dollar of revenues decline with revenues (p. 506). In his terms, trade-offs between economies of scale in the "traditional" sense and differentiation would then occur mostly at the level of demand elasticities: Given the tendency with economies of scale to increase physical output, combined with a stable customer base willing to pay premium prices for differentiated products, we cannot per se expect new customers who are less sensitive to the differentiated product to pay the same premium. Ergo, potential economies of scale are to be traded off against probably lower prices for increased demand. Reasoning from the perspective of obtaining price premiums, we would argue for higher expenditures on advertising, for example, to maximize revenues, while production costs have reached their optimum minimum level. Again, the overall profitability of increased spending on advertising will depend on the response of demand to higher prices. 32 

      Dixit (1979) employs a simple model (indeed a variant of the Bain-Sylos-Modigliani model) to trace the interactions between economies of scale, product differentiation and the scope for entry deterrence: There is an established firm (firm 1) and a potential entrant (firm 2), with demands of the form:

      P1 = a1 - b1x1 - cx2

      P2 = a2 - b2x2 - cx1

      In this model, 33  the established firm can commit pre-entry to an output level that it will produce post-entry, acting as a Stackelberg leader. The extent of product differentiation affects all of the parameters of demand for the two brands. He calls particular attention to the effects on the intercepts of the inverse demand functions and the cross-product term c. An increase in advertising and marketing expenditures (as the proxies for differentiation) may increase a1 relative to a2, while decreasing the cross-product term c. The intercept (a) effect measures an increased willingness to pay for brand 1 relative to brand 2 at every level of output; the decrease in the cross-product term (c) lowers the cross-elasticity of demand for the two brands (they become poorer substitutes). Therefore, within the price elasticity due to differentiation, Dixit also distinguishes between the increased willingness to pay (price premium) and the demand elasticity not only for the differentiated product itself (b1), but also for the non-differentiated one (c). So far, he would have no problem with Spence's assertion (1977) that differentiation is still subject to demand elasticities, which may change due to differentiation. Going further than Spence, however, Dixit introduces the cross-demand elasticity to affect demand of the non-differentiated firm as well, showing a clear negative correlation between increased differentiation and decrease in demand for the non-differentiated product. This finding is important, because it clearly states that entry prevention becomes more difficult the more the incumbent chooses to differentiate his products (Gilbert 1989, p. 506). As a consequence, limit pricing becomes less effective, eventually useless, if both firms offer independent products.

      In order to decide to what extent to apply differentiation-enhancing measures, Dixit compares the incumbent's profit when entry is prevented (that is, at the limit output) to the profit the firm would earn if entry occurred. 34  The a effect increases the profit earned when entry is prevented, and the c effect goes the other way, since entry prevention is more difficult when products are poorer substitutes.

      A priori, differentiation favours neither entry prevention nor entry accommodation. It is irrelevant whether an entrant will be able to make sustainable profits or not. What matters are simply the incumbent's own profits to be maximized: For one, the incumbent may choose to maintain heavy investment to continue or to create high price premiums with a somewhat limited customer base. This was at the origin of our reasoning with the Farrell and Shapiro model based upon switching costs.


III.6 The alternative with less differentiation

      Certain qualifications of the Farrell and Shapiro (1986) model had to be made in the first place, in order to apply it to the airline sector: Price discrimination is fostered rather than excluded in this industry, and marginal costs between incumbents and new entrants differ significantly in favour of the entrants. Farrell and Shapiro assumed the opposite in their model. The application of marketing tools, such as frequent flyer programmes, aims to increase switching costs for both customers and travel agents. The interpretation of this evidence can only be the following: Rather than exploiting existing switching costs, incumbents seek to create them. With the exception of artificially created frequent flyer programmes (which are mostly relevant for business class), we cannot find any significant switching costs for passengers. Due to price discrimination (mostly between business and economy class passengers), a single proposed equilibrium for incumbents by simply keeping old customers will not hold: At least for mass transport in economy class, where price sensitivity is very high, switching to a cheaper airline presents benefits, not costs, to the end consumer. However, when focusing only on the customer segments of first class, business and possibly fully flexible economy, Farrell and Shapiro's conclusion not to lower prices while keeping the established customer base remains quite intuitive, in the airline industry as well.

      In his model, Dixit points out the possibility of taking profits from a lesser extent of differentiation, also due to lower costs (advertising, etc.) and possibly higher demand due to the prevented entry of competitors and a certain degree of substitutability between products. 35  This strategy, apparently competing with the one based on differentiation advantages, would be trying to prevent the entrant from gaining market share by lowering the price differential and thus to gain market share at the cost of lower prices. It should be remembered that this approach would only work if the incumbent's service proposition were clearly considered at least equivalent or superior by most clients (customer preference), so that lower prices would win over entrants' potential clients. Within the Farrell and Shapiro model, this strategy would not present an equilibrium solution in the context of switching costs.

      An approach based on product proliferation with limited product space may lend itself to the incumbent's option to respond to entry when demand is very price sensitive. A common pattern among monopolists facing new entrants is product proliferation to prevent entry: The established firm may try to pack the product space and leave no profitable market niche unfilled for any entry. This form of pre-emption is a form of first mover advantage (Tirole 1997, p. 346) and so favours the incumbent only. In the context of the airline business, it is factors such as flight frequency and the variety of different flight classes that could proliferate in the indicated sense. An increasing variety of flight classes under one major carrier brand does not necessarily prove strong passenger loyalty to the incumbent. Rather, the introduction of frequent flyer programmes (with their costs) aims to compensate for this lack of brand loyalty. Such brand-packing makes particular sense for incumbents with dominance at airport hubs (Borenstein 1991, p. 1237). 36  Only at dominated hubs will a physically limited product space be found (unlike point to point). 37  Also, as the number of airport slots is confined, the incumbent can indeed use increasing flight frequency to pre-empt entrants. We also assume that only at hubs will the concentration of passengers allow for the broad variety of different ticket classes - for point-to-point routes demand will possibly be less elastic, so the multitude of classes may become pointless. As product proliferation aims to pack all, or most, of the conceivable (from an entrant's perspective) profitable niches, the products cannot be differentiated endlessly. That is, products will tend to be positioned "more centrally" (compare with Hotelling's concept of a line describing product space). Only at such less differentiated positions will the trade-offs between entry prevention, price premiums due to differentiation and costs for differentiation be reconciled.


Exhibit 26: Hub dominance and product space packing

      Other factors for differentiation such as point-to-point service or advertising do not lend themselves to pre-empting entrants. We infer that the pre-emption of entrants is possible by incumbents if they dominate an airport hub. Pre-emption may be pursued there by increasing flight frequency more than wanted by passengers, or by offering an excess number of differently branded fare classes, even though passengers to whom tickets are sold are sensitive to prices.

      Pursuing strategies of both increased product differentiation and pre-empting new entrants at the same time is not easy. Neither are the strategies equally profitable for the incumbent. 38  If we take further into account that unit costs for entrants tend to be significantly lower than for incumbents, then the second strategy presented becomes less and less sustainable for the incumbent. We can conclude that if a low-cost, non-differentiated entrant manages to obtain reliable slots for certain city pairs, or even at otherwise dominated hubs, an incumbent cannot profitably compete (without cross-subsidization) with that entrant, assuming a price-sensitive customer base. One single low-budget entrant obtaining airport slots for a given city pair makes the choice of entry pre-emption redundant for the incumbent on that given city pair.


III.7 Finding the optimal degree of differentiation while allowing for entry

      According to what has been shown above, it may be optimal for the incumbent to allow for entry and to maximize profits with a single or only a limited number of differentiated products. This would possibly place the product at a greater distance from any competing no-frills entrant's service proposition, while obtaining higher revenues due to higher prices, even net of differentiation costs. It is obvious that first and business class passengers are more disposed to pay such premiums for superior service, cabin comfort, etc., ultimately creating genuine brand loyalty. But even passengers flying economy may be willing to pay a premium above no-frills fares for direct point-to-point, high-frequency connections with a decent service on-board when buying a non-restricted, flexible economy ticket. As we showed in the chapter on economies of scale, there are no significant minimum efficient scales for intra-European traffic. Modern, smaller aircraft were especially adapted for regional markets in Europe, and we did not find significant economies due to bigger aircraft for average distances between 300 and 900 miles in Europe. So differentiating services further would not impede producing at low unit costs. Clearly, possible economies due to hubbing (centralization of work) and funnelling of traffic in order to fill up wide-bodied intercontinental carriers do not matter in our context of differentiation. On the contrary, passenger preferences for direct point-to-point connections in Europe and the risk of delays due to airport congestion (mostly at the hubs that are dominated by an incumbent) favour alternatives to hubbing instead.

      Well-differentiated service propositions by incumbents would allow for entrants, and it is possible that market share among price-sensitive passengers could rapidly be won by such entrants. To incumbents with higher unit costs than entrants, this would mean specialization in some classes only and emphasizing quality service (exploiting the subjective, non-measurable aspects as well: hostess' friendliness, etc.), in addition to the customer preferences shown above. Specific investments could include better-qualified personnel, service extension beyond the flight itself, redesigned cabins, more leg room, etc. (Frequent flyer programmes do not necessarily add to such differentiation as outlined).


IV. Sunk costs


IV.1 The role of commitment

      In order to deter entry, the Bain-Sylos-Modigliani (BSM) model suggests to producing close to the minimum efficient scale, with prices near average costs. This choice in output and price would only deter entry if it was applied before entry actually occurred. This postulate was criticized as unrealistic (Dixit 1980, p. 95). Why should pre-entry and post-entry prices or quantities necessarily remain the same? Trying to deter entry by threatening to keep output high and prices low was one thing, but would the monopolist really act accordingly once a new entrant came in? The issue of credibility emerged. In order to make his threats credible, the incumbent would need to "assure" potential entrants he would act once entry happened.

      It was safe to assume the monopolist would deviate to adapt his former price and/or output choice when entry occured, but only if such action was profit maximizing to him. In other words, post-entry profit maximizing choices (in prices and output) would be considered credible by definition.

      A post-entry price/output choice aimed at deterring entry, as outlined in the Bain-Sylos-Modigliani model, is indeed not very credible when applied in the context of a liberalized airline industry. Keeping in mind that entry is politically desired, then deterrence of such new entrants needs to be considered futile anyhow. In any case, an incumbent (who formerly occupied the role of a quasi monopolist for itineraries to and from his home market) cannot necessarily be expected to maximize profits when threatening to deter entry in the sense of Bain-Sylos-Modigliani. We can state that post-entry dynamics as predicted by Bain-Sylos-Modigliani a priori lack the credibility required to deter entrants.

      This is where the critical role of commitment sets in. Threats that would be costly to carry out after entry actually happens can be made credible by committing oneself in advance (Schelling 1960, Chapter 2). Such commitment before entry can render its fulfillment after entry optimal or even necessary. Whereas with a threat the actor has no incentive to carry out a particular action, a committed actor finds it in his own interest to take action after an event (such as entry) occurs. "Burning one's bridges" is a well-known example of commitment. Two armies wish to occupy an island that is located between their two countries and is connected by a bridge to both. Each army prefers to let the opponent have the island instead of fighting. Army 1 occupies the island and burns the bridge behind it. Army 2 then has no other option than to let army 1 have the island, because it knows that army 1 has no choice other than to fight back if army 2 attacks. This is the paradox of commitment: Army 1 does better by reducing its set of choices (Ghemawhat and Sol 1998).

      Although such commitment, as described in most of the literature (Spence 1977) would still be aimed primarily at deterring entry, it is also conceivable to commit to certain choices that would allow for entry. The common feature of strategies involving commitment is not necessarily to prevent entry from happening, but to create an incentive to determine post-entry actions to the detriment of entrants. It is in this intertemporal aspect of commitment that sunk costs become relevant. Sunk costs will act as a binding commitment because they present irreversible investment (Stiglitz and Mathewson 1986). Technically, this incentive is created by irreversibly altering the profit function of the incumbent.

      Only those costs that are irreversible can be considered sunk costs and have as such "commitment value". These need to be distinguished from fixed costs, which may have salvage value. The airline sector is a particularly suitable example for distinguishing these costs. Planes are certainly fixed costs and are highly mobile: On certain routes they may be considered the fixed cost component of unit costs. But planes can also be sold or deployed on other routes; thus, in general, they do not present irreversible investment and there is no commitment associated when buying a plane. But this general remark on planes needs to be qualified when taking into account further constraints of the airline business. For example, it is known that the airline industry operates in a highly cyclical market. During an economic slump, it may become difficult to sell such planes, with salvage values being extremely low and few alternative routes available to serve instead. Under such circumstances, the investment in planes becomes de facto irreversible, that is, sunk.

      A distinction needs to be made between firm-specific capital and industry-specific capital. The point made here is that industry-specific capital is much more easily recoverable than firm-specific capital. If certain sunk costs, which have accumulated over the years and present a form of capital investment, are not only specific to a single firm but can also be profitably sold within the entire industry - or even outside - the capital owner has not tied his own hands, that is, he is not really committed. Krishnan and Röller (1993) acknowledge this fundamental distinction in their paper examining the resaleability of resources. Accordingly, Gilbert (1989) defines as sunk investment only capital that is firm-specific, such as product-specific technology, human capital and advertising goodwill. As we are primarily interested in examining differences between incumbents and new entrants, we shall consider only incumbents' specific capital. If their specific capital would be easily resaleable within the industry, also to new entrants, the definition of sunk costs would not apply.

      If, for instance, an airline constructed a highly specified, proprietary airport, which for one reason or another could be used only by the incumbent's own fleet and no other airline (see network specifics, required density to operate economically, etc.), then such an investment could be considered as sunk, beyond being merely fixed. We can apply the same line of reasoning to an airline's fleet structure: Larger airplanes are likely to require more and better trained staff than smaller planes. Flying a Boeing 747 is reserved for only the most senior and experienced pilots. Smaller aircraft, such as a Canadair Jet or a Boeing 737, are regularly piloted by graduates fresh from aviation school. Maintenance requirements are much more demanding for larger planes and may present real challenges to industry entrants. The specific economics of larger planes also require highly specific routes, such as long haul and high density, in order to break even during operation. As a consequence, the market for such aircraft is much smaller than for short- and medium-distance carriers, which can economically operate on medium- or even low-density routes. Even during economic downturns, smaller aircraft seem to be much less penalized by low salvage values or lack of alternative uses than bigger aircraft. In addition, the possibility of leasing these planes to subsidiaries or other companies provides another means to reverse the investment. We therefore affirm that the type of airplanes per se that are currently used by incumbents to serve intra-European routes do not represent sunk costs for the operator.


IV.2 Commitment with excess capacity

      It was Spence (1977), who recognized that the incumbent's prior and irrevocable investment decisions could be a commitment. He argues (1979) that entry would be deterred when existing firms have enough capacity to make a new entrant unprofitable, although this capacity need not be fully utilized if entry does not take place. Thus, if the incumbent's capital level lowers the profitability of entry, he may want to "overaccumulate" capital.

      He assumes that the incumbent would build enough capacity to produce nearly competitive output. Before entry, monopoly output would be produced, while threatening to use maximum capacity if entry occurred. This threat, then, would only be credible if it were in the incumbent's post-entry interests to execute it (Dixit 1981). Only under these conditions would the incumbent expand his output and reduce prices in the post-entry period.

      If we assume that the demand structure before and after entry does not really change, and especially that price elasticity remains constant, we can infer something important: The choice of capacity before entry is really the choice of the cost function with which the incumbent will operate in the short run and in response to entry.

      In the following graph, production costs depend on installed capacity K (Dixit 1981), in addition to output. Capacity has a cost of s per unit and, once installed, has no alternative use. Marginal cost is v whenever there is excess capacity, and v+s when capacity and output are equal.


Exhibit 27: Kinked cost curve with excess capacity

      Only if the incumbent's excess capacity lowers marginal cost sufficiently for post-entry will the incumbent be induced to follow up on his threats to increase output. Post-entry marginal costs of the incumbent would need to be lower than average unit costs of the entrant. If marginal costs due to excess capacity did not undercut the entrant's average unit costs, the entrant could profitably exploit the incumbent's established route and reduce residual demand for the incumbent's operation on that given route. Then there would be no point for the incumbent in expanding output by reducing prices after entry has occurred.

      The differences between dynamic limit pricing and Spence's reasoning for the incumbent's pre- and post-entry behaviour in setting prices and output are now clear.

      
Exhibit 28: A comparison between two different strategic behaviours
  Dynamic limit pricing Excess capacity
Lever Economies of scale: Lower average unit costs due to optimal choice in capacity Reduced marginal costs post-entry due to excess capacity
Pre-entry Higher output takes advantage of economies of scale. Prices are accordingly low, signalling no profit potential for smaller scale entrants. Incumbent chooses monopoly output and pricing. Low output, high prices still deter new entrants because of commitment.
Post-entry High output and low prices are maintained, driving out entrants lacking a minimal efficient scale. Output at full capacity, with lower prices, takes advantage of lowered marginal costs and aims to drive out new entrants.

      Although Spence (1977) suggests that this analysis of excess capacity only formally applies to homogeneous product industries with some economies of scale, the spirit of his analysis carries over to other cases of capital investment. However, all of these alternative forms of investment would need to incorporate the following features: For one, they would need to sufficiently lower the marginal costs of the incumbent in the case of entry, as shown in Exhibit 27. Furthermore, the incumbent would need to be committed to his excess in capacity. As we have already mentioned, flight capacity cannot necessarily be considered as sunk. If an airline can find alternative uses for such excess capacity, entrants will not be deterred by it. We shall elaborate on this issue under IV.3.

      Following the rationale for sunk costs as reflected in the concept of excess capacity, post-entry competition will happen on a Cournot basis. The dominant model for such post-entry Cournot-Nash equilibria was formalized by Dixit (1981). The following exhibit shows the corresponding reaction functions for an incumbent as well as a potential entrant.


Exhibit 29: Reaction functions and equilibria with capacity investment

      The reaction function Ri(xe/m) is the incumbent's reaction function when the firm has no excess capacity, so that its marginal cost is v+s = m. If K>xi , the incumbent's marginal cost is only v and his reaction curve is Ri(xe/m), which is to the right of the reaction curve without excess capacity. The reaction function of the incumbent then depends on the installed capacity and its level of output xi. The entrant has no installed capacity. Therefore with respect to its entry decision, the entrant faces a marginal cost of v+s, which includes the cost of capacity. The entrant's reaction function is shown as Re(xi/m).

      If the incumbent has no installed capacity, his reaction function is Ri(xe/m), and the Cournot equilibrium occurs at the point E(m,m). If the incumbent holds excess capacity, its reaction function is Ri(xe/v), and the Cournot equilibrium occurs at E(v,m). Depending on the incumbent's choice of capacity, K, the post-entry equilibrium can be at any point between A and B on the entrant's reaction function. Point A corresponds to the incumbent's equilibrium output at E(m,m). This is the smallest output that can be sustained by the incumbent as a Cournot equilibrium. Point B corresponds to the incumbent's output at E(v,m) and is the largest output that can be sustained as a Cournot equilibrium. Outputs between A and B are equilibria for corresponding capacity investment, K. If, given an investment in capacity K, the equilibrium output that results if a firm enters the market is such that the entrant would not break even, a rational firm would choose to stay out of the market. Thus, prior capacity investment is a way to make an entry deterring limit output "credible".


IV.3 Sunk costs in the airline industry

      At this point we should ask which forms of sunk costs could present such commitment within the European airline industry. After identifying capital investments that were sunk - and not only fixed - we could check whether such capital is provided in excess by incumbents.


IV.3.1 Air transport capacity

      The most obvious point to start searching is transport capacity, usually measured in available ton kilometres or available seat kilometres: Is there any excess capacity among European former flag carriers? To answer this question, we have to account for the airline industry's idiosyncracies. Capacity can be reflected in the larger fleet of aircraft. It can also be reflected in a larger size of the average aircraft, given the same fleet. In addition, capacity would also be increased if given planes were used more frequently. While from the outside all these variables may appear to represent the capacity of an incumbent, their effects are very different.


Exhibit 30: Division of an incumbent's capacity

      Only new aircraft that are deployed on routes to old, or established, destinations can conceivably deter entry. Increasing capacity on new city pair routes is not viable to deter other entrants from entering older, already established routes. Any reflection on excess capacity, then, must focus on the evolution of capacity on city pairs, which was already established before liberalization started in 1992.

      As we have seen, airlines can make capacity choices for given city pairs along two dimensions: changing aircraft size and the frequency of flights to city pairs. Both dimensions impact on the average load factor: For a given demand, increasing flight frequency on a city pair lowers average load factor, as does the utilization of larger aircraft. The following table depicts the changes in average load factor of industry incumbents on European routes.

      
Exhibit 31: European traffic of national airlines

Airline
Passengers (million) Average load factor Passengers (million) Average load factor % change in no. of passengers
Aer Lingus 3.6 63% 3.9 69% 9%
Air France 25.7 57% 24.4 64% -5%
Air Portugal 2.8 65% 3.2 63% 17%
Alitalia 17.1 61% 20.1 63% 18%
Austrian 2.2 53% 2.2 50% -3%
BA 17.4 66% 21.0 69% 20%
Finnair 2.9 47% 4.5 60% 51%
Iberia 19.3 65% 17.7 64% -9%
KLM 5.2 57% 6.9 67% 33%
Lufthansa 22.0 54% 26.8 58% 21%
Luxair 0.5 54% 0.6 53% 39%
Olympic 4.9 66% 5.7 66% 16%
Sabena 2.4 46% 4.3 49% 75%
SAS 13.6 58% 18.6 57% 37%
TOTAL 139.7 59% 159.7 62% 14%

(Source: Civil Aviation Authority 1998, p. 97)

      Indeed, the above table strongly suggests excess capacity among major flag carriers at the beginning of the liberalization period. This excess capacity was utilized increasingly, while output increased in most cases. Among the major European carriers, excess capacity was particularly strong with Lufthansa and Air France, less so with BA. In comparison to the European mean, Lufthansa still maintained some - albeit reduced - degree of excess capacity in 1996. Without being able to pinpoint the source of excess capacity now, we can see its relevance to what was said by Spence earlier on excess capacity and lowering marginal costs, although the overall equilibrium output and average load factors differ significantly among incumbents. The fact that double digit passenger growth was reflected in only a small increase in the seat factor shows that airlines were keen on keeping up investment in capacity, instead of using existing capacity more efficiently.

      The question has to be asked, whether such excess capacity does in fact represent commitment, provide for lower marginal costs of the incumbent and thus deter new entrants?


IV.3.1.1 Aircraft size as commitment?

      As indicated in Chapter 1, bigger aircraft tend to have lower marginal costs than smaller aircraft. 39  This is especially true for high-density routes, where a single mid-sized airplane may not suffice to transport all passengers. However, filling up bigger aircraft is much riskier than filling up smaller ones. Adding one more passenger to a flight with many seats still available implies marginal costs that may be negligible. The reason for this is the overwhelming percentage of fixed costs on scheduled flights. In this respect, choosing the bigger aircraft would mean presenting more excess capacity, which would be filled up at very low marginal costs in comparison with entrant's smaller planes. So far, Spence's approach fits. 40 

      A potential new entrant for a particular city pair would find an incumbent serving the same route with an aircraft half empty. Even if the incumbent's prices for this route were excessively high, the entrant would be deterred because minimal marginal costs would encourage the incumbent to lower his prices if entry were to occur. Spence's approach still applies. We shall not assume that the potential entrant would want to invest in the same size of plane, since neither of the competitors would be profitable. But the entrant could either invest in a smaller plane or in a used plane the same size as the incumbent's. Both choices would imply lower fixed costs for the entrant, and consequently a lower break-even point than the incumbent. The entrant could be profitable even with a smaller output than the incumbent, while crucial passengers would be taken away from the incumbent, incurring losses for the latter.

      During economic growth, the incumbent's investment is not really sunk, as there is a favourable resale market for used aircraft. Under such conditions, the incumbent may look for other, more lucrative deployments of its plane, or consider the opportunity costs of leasing or selling it, instead of starting a price war against a low-cost entrant. If there was an economic slump, however, markets for "oversized" aircraft may dry up and then the definition of sunk costs is more likely to fit. Operating such "oversized" planes during periods of low demand for given city pairs, even when charging high prices to the customer, certainly shows an airline's commitment to that route. The incumbent would be forced to lower prices even below the entrant's average unit costs to maintain customer demand on his side and to prevent the entrant from breaking even. As a result, new entrants might effectively be deterred.

      Anecdotal evidence, however, strongly suggests that incumbents do not compete on aircraft size against entrants. On the contrary, they have invested heavily in smaller, but modern and comfortable aircraft such as Canadair Jets or Avro RJ85s, which seat only 50 or 85 passengers, respectively. Other aircraft, such as the ATR42, the Fokker 70 or the Saab 2000, also target this range of 50+ passengers per flight. Successful entrants, such as easyJet or Ryanair, operate Boeing 737s, which can seat between 120 and 140 passengers each. Clearly, in order to identify excess capacity with the incumbent, we have to look elsewhere.


IV.3.1.2 Routes as commitment?

      This question has to be considered in the context of the paragraph on excess capacity. Excess capacity on a route level would mean that an incumbent maintained routes in its network even though demand was clearly lacking, with not even the smallest aircraft reaching the usual average load factor. With such reasoning, the fact that an incumbent were serving a certain city route would deter new entrants from trying to fly the same city pair. This would be the case if the incumbent's marginal costs for serving such a route were lower than the entrant's average costs for operating on the same route. In fact, marginal costs for maintaining service on a given route may be quite substantial: Counters for ticket sales, check-in and embarkation are marginal costs based on the choice of a certain route. So are the costs for operating a plane - possibly empty - between city pairs, including costs of landing rights, air traffic control, etc. These marginal costs for the incumbent cannot be expected to be lower than the entrant's average unit costs, given that there is a minimum of demand. We can also consider the aspect of operating different sizes of aircraft on such routes: The bigger the plane, the higher marginal costs are going to be, due to higher operating costs when serving a city pair with a large empty plane, compared with flying a smaller plane - still empty - on such routes.

      Remarks that an incumbent's hub structure may offer lower marginal costs than the new entrant's average unit costs are not valid, because other profitable routes could be served more frequently with the same marginal cost advantages due to an airline's hub structure. All factors of production deployed for a certain city pair (such as aircraft, personnel, etc.) can easily be reassigned to other routes. The network structure of hub-and-spoke operations makes such shifts in resources between different spokes easier instead of harder. That is, such investment in particular routes cannot be considered sunk or irreversible.

      We may also reflect on the possibility of the incumbent "burning his bridges" by overextending his fleet of small planes (lower marginal costs), so that the existing routes are saturated by the incumbent's flight operations, and the potential for reassigning planes to other routes is very low, even within a hub-and-spoke system. The issue of opportunity costs would disappear, and the incumbent's marginal costs (post-entry) might remain on a very competitive level when compared with entrant's average costs. Such network saturation may indeed present the characteristics of sunk costs. Its salient feature would be to serve existing city pairs (providing there is a minimum of demand) with as many aircraft as possible. Such strategic behaviour could best be described as excess capacity through flight frequency.


IV.3.1.3 Flight frequency as commitment?

      Maybe excess capacity with regard to flight frequency for established city pairs is more apt to deter new entrants? Such frequent flights would need to present a form of sunk costs. As pointed out before, incumbents can saturate their route network (be it domestic or European) to a degree that alternative uses for the fleet of planes already deployed becomes extremely limited. The incumbent could furthermore concentrate such saturation on medium- to high-density routes within Europe because those are the routes on which entrants would be most likely to break even. Such deterrence would be reinforced if marginal costs for very frequent flights on a given city pair were significantly below the entrant's average costs for its smaller number of flights. If the incumbent could serve a given city pair many more times than the entrant without yielding any significant difference between the entrant's average costs and the incumbent's marginal costs, then there would be no commitment, as the low-cost competitor could profitably enter and even take away passengers from the incumbent, thus incurring lasting losses to the incumbent.

      Operating several flights on one city pair instead of several routes can indeed have decreasing effects on marginal costs. High frequency may substitute for intensive advertising, since the incumbent is already known for serving one particular route. The routine for sales, check-in and on-board personnel serving one city pair may be better developed than if they were to serve more city pairs. Aircraft and staff dedicated to only one city pair may be more productively employed, possibly making more roundtrips than if they were serving several city pairs a day. Turnaround at the airport is likely to be faster with only one city pair, and risky delays due to airport congestion are less likely for one city pair than for two. The example of shuttle services acknowledges these cost advantages: Ticket sales and distribution, as well as check-in, are streamlined and significantly less expensive. Errors in servicing, such as luggage handling, appear to be less costly to compensate. We can infer that a new entrant is more likely to be deterred from entering a city pair that is already frequently served by an incumbent than if the incumbent served different city pairs less frequently, ceteris paribus. We can conclude that the advantages due to shuttle service can be substantial but such investment may be hard for the incumbent to reverse: Although there are significant economies, there is little opportunitiy to deploy these services equally profitably outside of shuttling, since sufficiently dense city pairs are already saturated. The smaller aircraft types are usually dedicated to shuttle service only, with their own branding and advertising budgets (see Lufthansa's CityLine, etc.).

      We shall now examine whether changes in flight frequency really mattered in the years following deregulation. In particular, we are interested in validating these changes by comparing them to changes in the number of routes.

      
Exhibit 32: The operations of EU airlines to/ from and within their home state
Airlines Routes Flights
  Dec '92 Dec '97 Change Dec '92 Dec '97 Change
Aer Lingus 25 26 4% 1,897 2,228 17%
Air France* 137 120 -12% 10,119 13,877 37%
Air Portugal 48 40 -17% 1,175 1,487 27%
Alitalia** 120 93 -23% 7,662 8,988 17%
Austrian 25 22 -12% 1,055 1,455 38%
BA 92 81 -12% 7,129 8,897 25%
Finnair 44 53 20% 2,304 3,784 64%
Iberia*** 159 134 -16% 8,793 8,960 2%
KLM**** 53 50 -6% 4,619 4,491 -3%
Lufthansa***** 223 254 14% 14,124 12,840 -9%
Luxair 16 22 38% 515 518 1%
Olympic 70 73 4% 2,279 2,619 15%
Sabena 42 44 5% 2,541 3,847 51%
SAS****** 124 136 10% 12,738 16,390 29%
TOTAL 1,178 1,148 -3% 76,950 90,381 17%
* Air France figures include Air Inter and UTA.
** Alitalia figures include ATI.
*** Iberia figures include Aviaco and Viva Air.
**** KLM figures include KLM Cityhopper.
***** Lufthansa figures include Lufthansa CityLine and Condor.
****** SAS figures are not consolidated for operations between Sweden, Norway and Denmark.

(Source: Civil Aviation Authority 1998, pp. 105)

      The above figures are telling: Despite increases in output, the actual routes served by the incumbents were reduced (see BA, Air France or Iberia). The most notable exception to this rule is Lufthansa, which significantly increased its route network in Europe. The growth in the number of flights was generally strong, however. Bearing in mind that fewer routes were served, the frequency for particular city pairs must have grown even stronger. We can infer that incumbents chose to increase flight frequency on selected city pairs, possibly by installing shuttle services, as a dominant strategy to increase capacity. Again, Lufthansa is the most notable exception to this rule, apparently decreasing flight frequency for given city pairs and focusing instead on new routes.


IV.3.1.4 Hub-and-spoke operations as commitment?

      The strategic role of hub-and-spoke operations has already been discussed in terms of economies of scale. In such networks, airports serving small- and medium-sized communities served as spokes, connected to hub airports by frequent services of smaller jets (i.e. 737s) or turboprops. This system implied that direct flights from medium-sized airports tended to turn into at least one-stop flights via the carrier's hub. According to the US Department of Transportation (DOT), the hub-and-spoke system had increased competition and service in the US for small- and medium-sized communities as follows:

      Smaller cities have benefited from the shift to hub and spoke service. Most small cities receive more frequent service than previously, and many now receive service to connecting hubs from more than one major airline or their affiliates, thereby providing the traveler with a choice of airlines and routings to most destinations (General Accounting Office 1996).

      However, the hub-and-spoke system proves far less relevant for intra-European connections. Although exact data are lacking in official reports, we can assume that Europeans' willingness to change flights, or even to accept an extra landing of the same aircraft, in order to get to their European destination is rather low. Indeed, most major European cities are already interconnected by direct flights from the incumbents on domestic routes. 41 

      
Exhibit 33: High-frequency domestic non-hub routes served by incumbents 42 
Country   Typical number of weekday services
Germany Airline December 1992 December 1997
Munich Düsseldorf LH 14 12
Munich Berlin LH 12 11
Berlin Düsseldorf LH 11 10
Munich Hamburg LH 11 11
Country   Typical number of weekday services
Germany Airline December 1992 December 1997
Berlin Cologne LH 11 10
Munich Cologne LH 9 9
Berlin Stuttgart LH 9 8
Munich Dortmund LH 0 4
Berlin Nürnberg LH 3 5
Düsseldorf Hamburg LH 10 8
Berlin Dortmund LH 0 4
Berlin Hamburg LH 9 8
Munich Hanover LH 6 7
Hamburg Dresden LH 2 2
Total 107 109
Italy      
Milan Bari AZ 3 3
Milan Reggio AZ 1 2
Milan Naples AZ 7 8
Cagliari Florence AZ 0 1
Cagliari Genoa AZ 1 1
Palermo Lampedusa AZ 1 1
Palermo Pantelleria AZ 1 1
Total 14 17
Norway      
Bergen Stavanger SAS 1 6
Bodo Trondheim SAS 5 4
Total 6 10
Spain      
Barcelona Palma IB 10 9
Valencia Palma IB 3 7
Barcelona Ibiza IB 3 6
Menorca Palma IB 4 4
Barcelona Malaga IB 4 4
Barcelona Menorca IB 3 5
Barcelona Seville IB 5 5
Barcelona Bilbao IB 4 4
Ibiza Palma IB 3 4
Barcelona Valencia IB 3 7
Barcelona Pamplona IB 1 3
Alicante Palma IB 3 3
Total 46 61
United Kingdom      
Edinburgh Manchester BA 2 5
Belfast Birmingham BA 0 4
Belfast Glasgow BA 3 6
Aberdeen Newcastle BA 0 3
Jersey Manchester BA 2 1
Belfast Manchester BA 5 8
Aberdeen Edinburgh BA 1 0
Guernsey Southampton BA 0 1
Glasgow Manchester BA 5 5
Birmingham Glasgow BA 6 9
Aberdeen Manchester BA 3 4
Newcastle Southampton BA 0 1
Total 27 47

(Source: OAG 1993 and 1997)

      The intuition that hub-and-spoke operations are irrelevant on a national scale was confirmed by the above data.

      The same question needs to be raised and examined on a European scale: Due to longer flight distances, hub and spokes may become more efficient 43  and the availability of a wider route network than on direct city pair routes may induce the passenger to make an extra stop at a hub.

      
Exhibit 34: Some high-frequency European routes served by incumbents 44 
Country   Typical number of weekday services
France Airline December 1992 December 1997
Paris London AF 19 19
Paris Madrid AF 6 7
Paris Milan AF 6 7
Paris Dublin AF 1 3
Hub total 32 36
Nice London AF 19 19
Nice Rome AF 1 3
Lyon London AF 3 3
Non-hub total 23 25
Germany      
Frankfurt London LH 5 10
Frankfurt Graz LH 1 4
Hub total 6 14
Düsseldorf London LH 4 8
Munich Barcelona LH 1 2
Berlin London LH 1 0
Düsseldorf Barcelona LH 1 1
Hamburg London LH 4 4
Hamburg Helsinki LH 1 2
Munich Vienna LH 4 5
Munich Rome LH 2 3
Munich London LH 3 6
Munich Madrid LH 1 2
Non-hub total 22 33
France Airline December 1992 December 1997
Spain      
Madrid Paris IB 6 7
Madrid Lisbon IB 3 3
Madrid London IB 6 6
Madrid Brussels IB 2 3
Madrid Rome IB 3 3
Madrid Porto IB 1 2
Madrid Munich IB 1 2
Hub total 22 26
Barcelona Munich IB 1 1
Barcelona London IB 4 3
Barcelona Rome IB 2 2
Barcelona Lisbon IB 1 1
Barcelona Düsseldorf IB 1 1
Non-hub total 9 8
United Kingdom      
London Dublin BA 0 4
London Frankfurt BA 7 8
London Brussels BA 10 8
London Stockholm BA 4 7
London Amsterdam BA 11 11
London Paris BA 22 18
London Nice BA 5 4
London Düsseldorf BA 4 7
London Copenhagen BA 5 6
London Madrid BA 7 7
London Lyon BA 2 3
London Berlin BA 5 5
London Vienna BA 5 5
London Rotterdam BA 3 4
London Munich BA 5 7
London Lisbon BA 3 4
London Milan BA 6 7
London Cork BA 0 2
London Hamburg BA 4 5
London Barcelona BA 3 5
London Rome BA 4 7
London Oslo BA 5 5
London Athens BA 3 3
Hub total 123 142
Manchester Copenhagen BA 1 0
Non-hub total 1 0

(Source: OAG 1993 and 1997)

      The interpretation of the above table is somewhat ambiguous. For the sample data chosen, flights involving an incumbent's hub airport increased, for most of them above overall output growth rates (see also Exhibit 31). Whether this growth is particularly aimed to exploit the economies of hub-and-spoke operations, however, cannot be definitely inferred, as no data are available showing the percentage of passengers transferring to other flights at the incumbent's hub. If a person takes a flight from Frankfurt to London with either BA or LH for tourism or business, it is difficult to see how hub-and-spoke operations vis-à-vis point to point can lower marginal costs. On the contrary, an airline serving, for example, Düsseldorf-London (Luton) on a point to point basis is more likely to have lower costs, even when adding a second flight (due to lower landing fees at Luton compared with Heathrow). As we saw in Chapter 1, marginal costs on hubs and spokes decrease significantly only beyond a flight distance of 1,500 miles. Since most of the distances in Europe are shorter, marginal costs increase in fact. Looking at the table, however, we can observe that the densest frequencies (Paris-London, London-Frankfurt, London- Brussels, London-Amsterdam, Paris-Madrid, etc.) are well below the threshold of even 500 miles. The other rationale for using hubs and spokes was to be able to feed enough passengers into one hub, from which long-distance, high-capacity wide-bodied jets could be filled up, with very low unit costs per seat. Again, this rationale can only work for intercontinental flights, where such aircraft are used. Indeed, European incumbents rarely use bigger aircraft on intra-European traffic, although demand would allow for it. As we have shown, incumbents prefer to increase flight frequency instead. We can conclude that possible excess capacity due to hub-and- spoke operations is not apt to deter entry within Europe. The problem of airport congestion is too real, and public authorities could force incumbents to sub-lease any available excess in slots at hubs. As the allocation of airport slots is managed by the airport and public authorities, and the incumbents do not truly own these slot (so-called grandfathered rights), the allocation of such slots can be reversed by these public or semi-public bodies.


IV.3.2 The commitment in frequent flyer programmes

      Frequent flyer programmes (FFP) were introduced as a competitive tool by airlines to win frequent travellers by providing rewards for flights taken on a particular airline or group of airlines. These rewards usually take the form of points that count towards free flights, ticket upgrades, leisure travel and holidays, among other benefits. Many airlines view FFPs as defensive, because they were used for maintaining their existing customer base rather than gaining additional customers. FFPs offer two advantages for the airlines. First, they provide a useful marketing tool, supposedly better matching customer requirements on the basis of new marketing strategies. And second, since they are constrained by available capacity, they enable airlines to improve their load factors. The major drawbacks are the costs associated with administering the programme and providing the rewards. The airlines in the EU had introduced FFPs cautiously and with a large variation in the levels of rewards.

      By 1996, more airlines were awarding points the lowest fares and leisure travellers as well, having somewhat extended their prior focus on business or fully flexible tickets. Hence, airlines were keen to fill up economy seats of the aircraft on a marginal cost basis. There were also indications of competition on FFPs, with airlines increasing rewards and in some cases doubling them. Finally, business travellers seemed to be shifting their preferences for FFP rewards from earning free miles to being at the head of the waiting list for overbooked flights.

      Though the number of members in the major EU airlines' frequent flyer programmes was still tiny compared with US numbers, membership was rising. More than 85% of business travellers belonged to a frequent flyer scheme in 1996.

      But despite their apparent success, it was doubtful whether FFPs represented incumbents' commitment to deter new entrants. One key point of FFPs was to lock in customers and to increase an aircraft's load factor, thus allowing for lower costs due to less residual capacity available. To this extent, the potential for higher load factors and for larger, more efficient aircraft could imply lower marginal costs for the incumbent. Furthermore, European incumbents with their united FFPs (such as Lufthansa, SAS and Austrian) should then have a significant advantage. This, however, is not the case.

      For one, the administration of FFPs is expensive. Each FFP passenger has his or her own account, with the relevant administration, mailing and dedicated customer service at the airports to be taken into accounted. This increases marginal costs. Also, the low-cost approach of new entrants, especially with savings in personnel and service-related costs, is much greater than any effect of FFPs could possibly be. 45  This holds particularly true for economy or discount frequent flyers, where administration costs for these programmes become an important factor in overall costs. Here, the incumbent's marginal costs will probably be higher than those of a new entrant. For the business frequent flyer, as already mentioned, more of them prefer to use their bonus miles for upgrades or non-flight perks (vouchers for hotels or car rentals, etc.) rather than for more flights. Again, the theory of diminishing marginal costs due to FFPs does not hold. Moreover, in order to be committed to FFPs, the incumbent must not be able to sell them. The principle of "burnt bridges", however, does not apply. Nothing prevents an incumbent firm either stopping FFPs or even selling them if they prove to be less profitable than expected. The fact that FFPs are already diluted in their flight-specific dedication shows in the integration of not specifically flight-related services (car rentals, hotels, tourist tours, duty-free vouchers, etc.). In addition, it may even be lucrative for the incumbent to take a new entrant into its FFP, if this entrant adds value to it by enlarging the route network. All these considerations contradict a classification of FFPs as sunk costs.


IV.3.3 Computer reservation systems

      The real sunk-cost content of most IT-management systems - be it capacity management, yield and revenue management or FFPs - lay in the airline's computer reservation systems (CRS). Based on their fixed cost character, CRS provided significant potential for earnings with revenues growth. These CRS could be owned by a single airline (Sabre, for example, belonged to American Airlines). In Europe, CRS were usually held by consortia of airlines. Amadeus, a system operated jointly by Lufthansa, Air France and Iberia (each holding a 29.2% stake, with Continental Airlines holding 12.4%) had linked up in 1992 with two other systems operated by American and Asian airlines. 46  Worldwide, Amadeus counted 35 partner and owner airlines. 47  Another European CRS was Galileo International, whose European partner airlines were Aer Lingus, Alitalia, Austrian, BA, KLM, Olympic, Swissair and Air Portugal. The most important US partners were US Airways and United. All Galileo partner airlines also held stock in the company, although to a much lesser extent than the owners of Amadeus. 48  On a worldwide scale, Amadeus had 44,148 travel agencies linked up, while Galileo had 38,400 agencies served with its CRS. 49 

      In Rezendes (1988), the anti-competitive effects of airline CRS were examined. For one, such effects were found with incremental revenues. These incremental revenues arose initially because of biased display of flights on travel agents' video screens. Such a bias was somewhat tempered from the beginning in Europe, since a code of conduct for CRS was adopted as a regulation by the European Community in July 1989 (Civil Aviation Authority 1993, p. 8). As the inherent incentives persist for owners of a CRS to favour their own flights directly or indirectly, and as the technology of CRS continues to develop rapidly, these codes of conduct will need to be revised continuously to avoid such incremental revenues. For the US, a DOT report found that even after the screen bias rule had gone into effect, CRS-vendor airlines increased revenues by 9% to 15% (according to CRS vendors' data) and by 12% to 40% (according to DOT's own analyses) over what they would have been without of CRS ownership. 50  In Europe, the aforementioned biases were not longer an issue in reports on the European airline industry. This may also be partly due to the adoption of the no host technology by both Amadeus and Galileo in the early 1990s. 51  This technology provided the agent with reliable and unbiased information, also on smaller or non-owner airlines. As we are looking for an analogy with excess capacity, we are interested in identifying diminished marginal costs after entry and not in increased marginal revenues vis-à-vis an entrant.

      The other potential for anti-competitive effects came from booking fees linked to CRS. Such booking fees, if they exceeded costs, could transfer cash flows made by one airline to another airline. Competing airlines, who pay booking fees, have little alternative but to pay those fees if they wish to remain competitive in the air travel business. 52  The option of being listed in CRS, but not paying booking fees and thus being excluded from CRS bookings is not considered viable. The Rezendes (1988) report states: "...An airline competing with other airlines in major routes, particularly a new entrant, could not use this strategy..."(p. 11). In Europe, probably the most notable exception to this rule is easyJet, where flights cannot be booked over CRS and reservations are made directly with the airline.


Exhibit 35: The marginal cost benefits of owning a CRS

      The above graph depends critically on several parameters. The difference in marginal costs between the CRS owner and non-owner airline is a function of booking fees exceeding unit costs. Without any unit profits, there is no cross subsidy possible from non-owners to CRS owner airlines. With per unit losses, the presented relationship may in fact become inverted. Also, the more non-owner airlines and their networks participate in another airline's CRS, the more of such booking fee unit profits are likely to be distributed to the CRS owner airlines. We could have displayed this profit transfer relationship as a constant MC-curve for the owner airline or an increasing marginal profit function originating from the non-owners (implying that unit profits are likely to increase with a wider network of airlines joined into it). This, however, would have strained our requirement for marginal costs too much. Instead, we preferred to assume that such unit profits are transferred to the CRS owner airline, where they will be strategically used to diminish marginal costs on the owner's routes in order to deter new entrants. Any airline wishing to establish its own reservation and sales system can theoretically escape from this mechanism. A direct sales approach may even save between 7% and 15% of the regular travel agent's commission on tickets sold (see below). This, however, is likely to work only for low-cost entrants on specific low- to middle- density city pair routes.

      
Exhibit 36: Distribution of owner and non-owner potential passengers for booking on CRS
Airline's stake in corresponding CRS
Amadeus

Galileo*
Non-owner incumbents Non-incumbents**
Aer Lingus (0.1%)   3,90    
Air France (29.2%) 24,40      
Air Portugal (0.1%)   3,20    
Alitalia (8.7%)   20,10    
Austrian (0.1%)   2,20    
BA (14.7%)   21,00    
Finnair     4,50  
Iberia (29.2%) 17,70      
KLM (12.1%)   6,90    
Lufthansa (29.2%) 26,80      
Luxair     0,60  
Olympic (1%)   5,70    
Sabena     4,30  
SAS     18,60  
TOTAL (m passengers) 68,9 63 28 80
% of total passengers 28,72% 26,26% 11,67% 33,35%
* Galileo numbers does not include Swissair figures. Including Swissair, Galileo's total would approximately equal Amadeus' total of passengers moved by CRS owner airlines.
** There were no exact figures for total non-incumbent traffic in Europe. The given figure is an approximation from the CAP685.

      If we assume that both CRS in Europe have similar market presence (and that cross bookings for owner airlines on another CRS would be mutually balanced), we can observe a residual 45% of European scheduled passenger traffic, which may significantly alter the profits generated by the competing CRS. However, we have no reason to believe that these smaller airlines would favour one CRS over the other. The salient feature of entry-deterring effects of CRS in Europe then would be their differing ownership stakes. Iberia, Lufthansa and Air France are likely to lower their marginal costs significantly, due to profit transfers from other airlines' paid booking fees. It is interesting to note that Swissair has both a relatively high participation in Galileo (13.2%) and transports relatively few passengers in Europe. The combination of these factors is likely to reduce Swissair's marginal costs even more than Lufthansa's much higher stake in Amadeus reduces its marginal costs. KLM's situation is comparable to Swissair's.

      The interest in selling its ownership and buying another one for an airline in the competing CRS is not very pronounced. A shareholder would lose its stake, and it would be unlikely that as a new comer to an established system it could get the same percentage share as it had before with the former CRS. It is also likely that clauses within the CRS agreement would make it difficult and expensive for shareholding incumbents to bail out. We conclude that ownership stakes in CRS do present commitment. The higher the stake and the bigger the underlying route structure, the more the incumbent will be apt to deter new entrants, in analogy with Spence's kinked cost curve.


IV.3.4 Alliances: Code sharing and franchising

      The most rapid transformation of the industry structure was happening through alliances, both within the EU and around the globe. These alliances took a number of forms, from equity investment to code-sharing agreements and franchising. The latter two will be discussed in more detail

      Code sharing

      Code sharing was a form of cooperation between airlines. It let airlines place their flight codes on flights that were actually operated by other airlines. Conceptually, two forms of code sharing were distinguished. Interlining involved placing an airline's code on a connecting service that was in reality operated by another airline. This meant that an airline was able to offer to the customer a wider network in its own name than it actually operated. The other form of code sharing went further and adjusted flight operations of both airlines involved. With shared codes, formerly competing airlines might have chosen to operate only one flight for a certain city pair, where before they had one flight each. 53 

      
Exhibit 37: National carrier code shares with other EU airlines in 1992 and 1997
Airline 1992 1997
Aer Lingus Sabena Sabena, Finnair, Hamburg Airlines, KLM
Air France Luxair, Austrian, Sabena, Tyrolean Luxair, Alitalia, Brit Air, CityJet, Eurowings, Finnair, Flandre Air, JEA, Maersk Air, Regional Airlines
Air Portugal LAR Transregional Aerocondor, Hamburg Airlines, Portugalia, SATA Air Acores
Alitalia Austrian Air France, Alpi Eagles, Azzurra Air, Brit Air, British Midland, Eurofly, Finnair, Luxair, Maersk Air, Meridiana, Minerva
Austrian Finnair, Air France, Alitalia, KLM, Olympic, SAS Finnair, Iberia, Lauda Air, Lufthansa, Sabena, Tyrolean
British Airways CityFlyer, Deutsche BA, Brymon CityFlyer, Deutsche BA, Brymon, Air Liberté, British Regional, GB Airways, Loganair, Maersk Air (UK), Sun-Air
Finnair Austrian, Lufthansa Austrian, Aer Lingus, Air France, Alitalia, Braathens, Maersk Air, Sabena
Iberia   Air Nostrum, Austrian, British Midland, Lauda Air, Luxair, Regional Airlines
KLM Tyrolean, Austrian Tyrolean, Aer Lingus, Air Exel, Air UK, Eurowings, Maersk Air, Regional Airlines, Transavia
Lufthansa Cimber Air, Lauda Air, Tyrolean, EuroBerlin, Finnair Cimber Air, Lauda Air, Tyrolean, Air Dolomiti, Air Littoral, Augsburg, Austrian, Britrish Midland, Business Air, Contact Air, Luxair, Rheintalflug Seewald, SAS, VLM
Luxair Air France Air France, Alitalia, Conseta, Iberia, Lufthansa
Olympic Austrian  
Sabena Air Lingus, Maersk Air, Air France, British Midland, Brymon Aer Lingus, Maersk Air, Austrian
Finnair, Regional Airlines, Tyrolean, Virgin Express, VLM, Sobelair
SAS Austrian British Midland, Cimber Air, Falcon Aviation, Lufthansa, Regional Airlines, Skyways, Spanair
Wideroe's

      (source: Official Airline Guide 1993 and 1998)

      Besides the overall growth in code sharing, this table also shows the volatility of such partnerships. Most of the more important partnerships of 1992 had been replaced by new, more promising ones in 1997 (see partners for Austrian or Air France, etc.). Unfortunately, we cannot tell from this table which kind of code shares prevailed: simple interlining or the more collusive adjustment of mutual flight operations.

      At this point, we shall continue with an approximation, albeit a realistic one: Code shares between incumbents tended to fall overwhelmingly into the second category. If Lufthansa, for instance, shared codes with SAS, we know that both networks had covered the most important routes for Europe from their own hubs independently before. Routes from Sweden, Norway or Denmark to Germany (and vice versa) were based on former bilateral agreements. We can infer from this historical evidence that these newly formed code shares do not intend to exploit new routes that have previously never been served by one of the carriers. Nor is it likely that the routes concerned would be low-density routes (within Europe), which were unprofitable for an incumbent to exploit by himself with his regular flight operations.

      
Exhibit 38: European incumbents and their code-sharing incumbent partners
  Incumbent partners in 1997 Code-sharing potential*
Aer Lingus Sabena, Finnair, KLM Low
Air France Luxair, Alitalia, Finnair Average
Air Portugal   None
Alitalia Air France, Finnair, Luxair Average
Austrian Finnair, Iberia, Lufthansa, Sabena High
British Airways   None
Finnair Austrian, Aer Lingus, Air France, Alitalia, Sabena High
Iberia Austrian, Luxair Low
KLM Aer Lingus Low
Lufthansa Luxair, SAS, Austrian Average
Luxair Air France, Alitalia, Iberia, Lufthansa High
Olympic   None
Sabena Aer Lingus, Austrian, Finnair Low
SAS Lufthansa Average
* This rating was directly related to the partner's network size in Europe. The bigger the network, the more route operations could be adjusted between both incumbents. Another factor was the density of key routes between the partners: Dublin-Amsterdam (AL/KLM) had less potential for adjustment than Frankfurt-Helsinki (LH/SAS).

(Derived from Exhibit 37)

      This rating was directly related to the partner's network size in Europe. The bigger the network, the more route operations could be adjusted between both incumbents. Another factor was the density of key routes between the partners: Dublin-Amsterdam (AL/KLM) had less potential for adjustment than Frankfurt-Helsinki (LH/SAS).

      The question at this point is whether such shared codes (not interlining) represented commitment of the incumbent. At first glance the answer would appear to be negative, due to the short duration of most such alliances. Indeed, those airlines that appeared to extract the greatest advantage were relatively small players (see Luxair, Austrian or Finnair). Looking at the table we find the most important European players (see BA, LH, Air France or KLM) were not particularly disposed to these kinds of alliances. The market values intra-European routes, especially high-density ones, and, a priori, nothing prevents an incumbent from changing partners if he believes this to be more advantageous. The definition of sunk investment does not fit with this type of code sharing. But maybe there are decreasing marginal costs as a function of the number of codes shared? Can shared codes present a form of excess capacity? This would imply that airlines that shared many codes would present lower marginal costs than those that held fewer code shares. This is not the case: The potential for reducing costs by combining, and consequently by eliminating, flights on high density-routes aims to reduce excess capacity, not create it.

      Interlining is another dominant form of code sharing. In Europe, it most often took the form of regional alliances and usually involved a national airline which formed a partnership with a regional carrier. 54  The regional airline was presumed to have a more appropriate fleet as well as greater expertise in serving the smaller markets, consisting of low density routes. The proliferation of such partnerships was impressive. 55  and Lufthansa was said to hold the greatest number of regional alliances in 1997.

      
Exhibit 39: Lufthansa's regional partners in 1997 56 
  Home country Number of code shares
Air Littoral France 26
Air Dolomiti Italy 12
Rheintalflug Seewald Austria 3
Tyrolean Austria 3
VLM Belgium 3

      (Source: Civil Aviation Authority 1998, p. 154)

      The system of interlining maintained access for incumbents to routes, that the incumbent could not economically serve by himself (due to his cost structure and operational constraints). In this respect, marginal costs for an incumbent serving such routes with his own operations would not be sufficiently low to undercut an entrant's average costs. However, in order to determine, whether these interlining arrangements presented a viable commitment to deter new entrants, we need to compare the average cost curves of the regional, interlined airline with those of a potential new entrant. Regional airlines do not reason on a marginal cost basis, as they seek to break even and to compete head to head against low-cost entrants. A priori, we cannot say whether the cost structure of the regional code-share partner is lower than that of a new entrant. But we know that incumbents use these agreements to feed a certain number of passengers on to these code-shared flights. 57  Regional flights from or to airports where the code-sharing incumbent maintains a dominant share are especially powerful in providing a minimum average load factor for the partner airline. This enables the regional partner to plan with lower residual capacity (higher load factor) or even to employ larger aircraft than the new entrant, hence exploiting advantages in efficiency when operating larger planes. Due to the regional partner's dependence on the incumbent's steady provision of passengers, and due to the geographical dependence on an incumbent with hub dominance, it is very unlikely that these partners will leave for other incumbents. For the same reasons it is unlikely that the incumbents would transfer shared codes to other incumbents. Their value is simply too closely linked to the incumbent's hub dominance to be worth selling. Interlining then must be considered as commitment to deter entry on these regional routes. Employing "Jumbolinos" or Canadair jets on such routes could be interpreted as a form of excess capacity when new entrants would most likely serve such routes with turbofan-powered smaller aircraft. 58  However, as we have stated, the lever for such cost advantages of the interlined partner airline is linked to the incumbent's hub dominance. That is, interlining arrangements for undominated airports, especially for seventh freedom routes, can hardly present such commitment and are unlikely to deter new entrants effectively.


Exhibit 40: Average costs (per passenger) for regional carriers with interlining

      Franchising

      The concept of code sharing for interlining became more fully developed with the franchising approach. The basic rationale, however, remained the same: to maintain a presence on such routes (mostly low-density ones) where the franchisee was more suited to serve than the incumbent with his high-cost operations. The incumbent's interest was to transfer such routes, which he had previously operated by himself, to the franchisee. Usually, the partner operated under the incumbent's brand and this allowed the incumbent to maintain his own profile on such routes (Flight International, 7-13 May 1997). Unlike most interlining arrangements, the franchisee could easily operate beyond an only regional scale. BA's partners, like CityFlyer, Brymon or GB Airways, served the domestic market and even some international routes. Air France's partners, like JEA or Brit Air, clearly went beyond a merely regional level with their international routes between France and the UK.

      Although data on franchising between European incumbents are scarce, some observations in the case of BA can be made.

      
Exhibit 41: Scheduled traffic before and after franchise arrangements
  Total Domestic
  1992 1996 Change 1992 1996 Change
Brymon 293,439 461,158 57% 190,119 350,898 85%
Maersk 311,671 443,100 42% 116,643 154,760 33%
CityFlyer 234,818 849,145 262% 145,815 330,659 127%
Loganair 590,727 251,214 -57% 573,029 244,186 -57%
British Regional - Manx 643,932 1,589,154 147% 524,520 1,346,835 157%
GB Airways 233,837 484,400 107% - - -
Total of BA franchisees 2,308,424 4,078,171 77% 1,550,126 2,427,338 57%
BA 27,387,460 32,340,654 18% 5,765,337 6,132,523 6%
Other UK carriers 8,546,604 14,710,257 72% 4,379,964 6,425,249 47%

      (source: Civil Aviation Authority)

      It was assumed that these significant increases in traffic were largely due to BA's feed traffic in connection with its airport hubs (Heathrow and Gatwick). About 500,000 passengers a year were estimated to connect between BA and its franchisees (Flight International, 25-31 March 1998). A 1996 Civil Aviation Authority origin/destination survey compared the level of connecting traffic on a sample of routes operated by a franchisee and by an airline independent of BA. In all cases the franchisees had a higher proportion of traffic connecting on to BA services than their rivals and, generally, a higher overall connecting proportion, even when the fanchisee was based at Gatwick and its rival at Heathrow.

      We can infer that the connecting traffic from or to incumbents had a decreasing effect on the franchisee's average costs, similar to the effects of interlining. We are tempted to apply the same average cost curve for franchisees as we have done for the regional partners with interlining agreements. However, these franchise partners quite often serve other airports, where the incumbent has only low local presence and hence little traffic to feed on to the partner's connections. Especially for the fifth and seventh freedom routes, there is no reason why an independent carrier should have higher average costs than a franchised one. The franchise agreement can also be considered as relatively durable in its nature. In any case, franchise agreements are more durable than most large-scale intercontinental alliances between major incumbents' networks (say KLM and Northwest). The reasons for such durability are several: For one, franchise contracts cannot be resold. The franchisee's interest in getting connecting services from the incumbent prevents it from looking for other partners with geographically less interesting hub airports. On the incumbent's side, his potential gains in finding another new entrant that might serve the same routes even less expensively while maintaining a minimum standard of quality, are remote. We can conclude that franchise agreements represent an incumbent's commitment, as long as they involve a significant amount of the incumbent's connecting service.


IV.3.5 Advertising

      Schmalensee (1983) shows how advertising is to be considered differently from sunk costs. In particular, over-investment in advertising before entry is not optimal to deter entrants: "Despite the obvious resemblance to... the use of investment in production capacity to deter entry, here the incumbent monopolist never finds it optimal to advertise more if entry is possible than if it is not... These results and others presented make plain the dangers of analysing investments in advertising largely by analogy to investments in production capacity. They also suggest that the strategic implications of investment in advertising are highly sensitive to the effects of advertising on buyer behaviour and to the nature of post-entry equilibrium..."(p. 636). The issue of advertising is more profoundly treated in chapter III, which deals with product differentiation.


IV.4 The Dixit model applied to sunk costs in the airline business

      In order to deter a new entrant from serving a city pair, the incumbent would need to serve - in using Dixit's model of excess capacity as an analogy - the given city pair by committing to a particular kind of strategic behaviour.


IV.4.1 Entry deterrence by committing to flight frequency

      The incumbent can commit to serving the city pair with a very high frequency, such as a shuttle service. As shown, high flight frequency presents commitment, lowering marginal costs in the case of entry. Such commitment is independent of efficiency gains due to operating bigger aircraft. With this logic, deterrence would be successful if such high frequency lowered marginal costs (when operating below full capacity after entry), so that prices would drop enough to prevent the entrant from achieving a sufficiently high load factor to operate at least one flight profitably on the given route. In analogy with Dixit, the incumbent would operate high frequency flights (with smaller aircraft) at lower average load factors and at comfortable prices before entry occurs. Excess capacity in both seats and frequency would allow the incumbent to jack up prices on special occasions, such as peak periods, holidays, etc. Once entry happens, pricing can be done on a marginal cost basis, undercutting the entrant's average unit costs and thus preventing him from breaking even. In addition, the incumbent may even maintain his full service range, maintaining premium passenger service and thus finding potential for subsidizing losses from marginal cost pricing at the bottom end of the passenger spectrum. A low-cost entrant is not likely to propose such a full range of services to his customers. Therefore, in order to fill up his entire capacity, he cannot discriminate on price, but will need to counter the incumbent's lowest price, which will be based on his marginal costs.

      The empirical part of this thesis (see section VII) will focus on the significance of flight frequency as a barrier to entry and proceed to measure its impact on ticket prices. An empirical assessment of price and output changes with respect to entry or exit of competitors into established routes, as suggested by the Dixit model, shall not be conducted. Although the Dixit model may apply for sunk costs, other types of barriers to entry may have the same or even a greater impact. Section VI presents a framework that is more universally applicable for our purpose of identifying all relevant barriers to entry and measuring their impact on prices, independently of entry/ exit dynamics.


IV.4.2 Consequences of strategic behaviour with CRS

      The issue of cross-subsidies arising from ownership in CRS is not easy to apply to the Dixit rationale. If we assume that profits derived from booking fee profits are used strategically to diminish existing marginal costs for the incumbent's own operations, we can only allocate these lowered (or rather subsidized) marginal costs to the entire route network of the CRS-owner incumbent. Evidently, the smaller the incumbent's route system for a given ownership stake, the greater the cross-subsidization effect on a per city pair basis.

      Applying Dixit's graph, we can discern two main effects:

  • A shift of the incumbent's reaction function to the right. This depends on the incumbent's ownership stake in the CR system, the size of his own route structure and, of course, the extent to which the CR system produces profits.
  • Whether the entrant will join a CRS or not. This determines the entrant's own marginal costs, and thus may lower his own Cournot-reaction function.

      The hypothetical case that extremely expensive booking fees might alter the demand for tickets and may change the slope of the depicted reaction functions can be ignored. This yields an adapted Dixit graph:


Exhibit 42: An analogy to Dixit's model with commitment in Computer Reservation Systems

      This model shows two extremes of Cournot equilibria: A and F. With A as post-entry equilibrium, the lowest degree of deterrence appears for an entrant. First, the incumbent does not obtain significant cross-subsidies from CR systems, because his ownership stake is relatively low in comparison with his overall route network and the degree to which he uses the CR system himself. Second, the entrant's own marginal costs do not increase with the CR system if the entrant bypasses such systems. The other extreme, at F provides maximum deterrence to new entrants because an entrant subscribed to a CR system would compete against an incumbent benefiting from CR system due to his high ownership stake relative to the size of his own route structure (and his own bookings). Under these circumstances (at equilibrium F), CR systems develop their highest degree of deterrence. In other words, if an entrant were to chose a city pair to compete against an incumbent, it should pick, ceteris paribus, those routes with competition from BA or Alitalia, without having to do bookings on computer reservation systems. Between the extremes shown, multiple equilibria (B, C, D, E) are all possible, with their differing degrees of deterrence.

      It is, however, not impossible, that entry may be successful at point F: If booking fees were modest, and cross-subsidization from CRS low (due to low profitability of such systems, especially in the first years of operation), the differential of an entrant's and an incumbent's marginal costs may become very small. If CRS were to become unprofitable, due to the emergence of alternative channels of distribution, or, due to competition from other CR systems, then indeed, deterrence might collapse altogether and entrants might actually benefit from competing on costs by advertising their lower costs on incumbents' CRS.

      The question whether computerized reservation systems act in the way that the analogy of the Dixit model would suggest, or in some other way that might reflect a barrier to entry, shall be empirically assessed in chapter VII. If CRS are found to be a significant factor, its impact on price changes will be measured.


IV.4.3 Consequences of interlining behaviour (post-entry)

      Applying Dixit's model to strategic behaviour with interlining seems obvious. The action to cover low-density city pairs from dominant hub positions by applying the interline partner's lower cost structure can be interpreted as the post-entry reaction along models with excess capacity. In fact, interlining agreements appear even more subtle than the "classical" excess capacity approach of entry deterrence: Instead of having to invest in excess capacity, and thus incurring higher average costs, and taking the risk of under-utilization of this spare capacity, interlining leaves this risk entirely to the interling partner. Also, instead of threatening to use this excess capacity, the interlining partner actually already operates on these routes with adapted operations. The effects of entry deterrence due to excess capacity seem to be obtained, while limiting sunk costs for the incumbent airline.


Exhibit 43: Kinked cost curve for interlining agreements

      The incumbent's capacity choice is based upon service on medium- and high-density routes. For lower-density routes, his operations are less adapted and marginal costs are not sufficently low (see v1 compared with v2+s2, which are average unit costs for a regional airline). Operating at lower-densitiy city pairs than the incumbent can still be profitable for the regional partner. If entry occurs on this regional level, the interlined regional airline can still lower prices to its idiosyncratic marginal costs (v2) to drive out or deter entrants. In addition, feeder service with the interlined partner incumbent will provide, ceteris paribus, more traffic for the interlined regional airline than for any entrants.

      The constraints of such deterrence by interlining are, however, clear: The incumbent needs to "recruit" an existing airline for this partnership. If several low-cost airlines are already competing on a given city pair, the advantage of such interlining agreements may not be substantial enough to force the other airlines to exit the route, as they in turn may use pricing based on marginal costs. The scenario for entry deterrence with interlining then must be: The incumbent code shares with the only low-cost operator on given routes (which feed into the incumbent's hubs), or the incumbent sets up his own low-cost company as the first operator serving these routes (also by eventually withdrawing existing route service by the incumbent's own operations).

      In fact, the incumbent is not trying to undercut low-cost competitors' prices on regional routes, but to capture as much existing demand as possible along the lines of Cournot competition by attaining a similarly competitive cost structure as potential entrants. It is questionable whether such a Cournot share of a low-density market, plus additional demand for feeder services into the incumbent's hub, will suffice to deter or drive out other competitors. If this Cournot share plus additional demand due to feeder advantages (shared codes, schedule alignments, connecting services, etc.) allow the interlined carrier to use bigger, more efficient aircraft at equally high load factors as the non-interlined competitors, then average costs can decrease further than those of the regional competitors. In such an optimal case, non-interlined competitors could become unprofitable and eventually be driven out of the market.


IV.4.4 Consequences of strategic behaviour with franchising

      The effects of post-entry Cournot competition with franchising are similar to what has already been described for interlining arrangements. In fact, the incumbent tries to lower his cost structure to a level comparable with low-cost operators by finding franchisees, as a first step. As a second step, a uniform branding and assured quality control by the incumbent franchisor, as well as a high percentage of connecting services between the incumbent franchisor and the franchisee, may allow for higher load factors than would be the case with interlining partners. Also, due to the usually longer flight distances - as compared with mostly regional interline arrangements - larger, more efficient aircraft for the franchisee can be employed. The impact on average costs could be depicted as follows:


Exhibit 44: Average cost effects of franchising on low-density routes

      In analogy to Dixit's post-entry Cournot competition with excess capacity, we would derive the following post-entry equilibria under franchising agreements:


Exhibit 45: Cournot equilibria with franchising partners

      As shown above, the incumbent can influence the low-cost competitor's post-entry output by working with franchisees. Although this does not necessarily mean that entrants would be deterred, or that low-cost competitors would be driven out of the market, their output would be reduced. We do not assume that at point B the competitor would be sufficiently harmed to incur losses. The reason is obvious: Ceteris paribus, the franchisee himself would then incur losses, too. The real question is whether point C lies far enough to the right on Rent to make competition unprofitable. Again, the decrease in average costs due to more efficient, usually bigger, aircraft at equally high load factors as the entrant is crucial. It would allow for lower pricing post-entry, but could only be maintained with advantages in demand for the franchisee. Otherwise, the larger, more efficient plane (which is not a sunk cost) might not obtain a sufficiently large load factor to operate profitably and the entrant might serve his residual demand with a smaller plane. To obtain such a surplus in demand, compared with an independent competitor, the incumbent must provide a powerful brand with the notion of quality, as well as connecting services through hubs.

      The empirical validation of the above predictions for strategic behaviour based on interlining and franchising agreements, however, is outside the scope of the research design of this thesis: our sample of 35 city pairs contains mostly high and medium- density routes. On such routes, interlining and franchising are extremely rare - too rare to be tested statistically. In these cases, code sharing with other incumbents was more prevalent (the impact of such code-sharing on prices was empirically tested, although we had not confirmed commitment value of such code sharing, see IV.3.4).

      Beyond the practical aspects of sampling the "right" city pairs, empirical testing of such strategic behaviour should focus on intertemporal aspects of price changes before and after entry of competitors on such low-density routes. Our research design, however, uses contestability theory that allows us to empirically test for entry barriers and to measure their impact on prices, independently of actual entry. At last, interlining and franchising partners cannot necessarily be considered a full part of the incumbent's network. Even if their efficient cost structure may deter other low-cost entrants from competing on certain routes, it would not necessarily imply that the incumbent would reap the financial rewards of such behaviour.


IV.5 A comparison between Dixit and Bain-Sylos-Modigliani

      ith a commitment to flight frequency and code sharing agreements, we can indeed confirm that a mechanism corresponding to excess capacity is in place. Lower marginal costs do not originate from economies that lie in the aircraft's technology, but rather from economies in organization and economies on-ground (shuttle-economies). In terms of interlining and franchising agreements, the incumbent controls city pairs without owning an adapted cost structure to operate these flights by himself. Again, hub-and-spoke operations prove instrumental, with a player dominating a hub being privileged to exploit such effects of excess capacity. After entry, or in the presence of competition on a given city pair, flight frequency should be maintained at levels well above the entrant's. In the presence of entrants, the excess capacity rationale would predict price competition on a marginal cost basis. Like this kind of Cournot competition, the BSM model would also predict lower prices after deregulation for the incumbent, who will seek to exploit his minimum efficient scale as monopoly output can no longer be maintained. Ceteris paribus, these prices would need to undercut the entrant's average costs on given city pairs in order to make the entrant's operations unprofitable.

      Unlike the assumptions made by Dixit or the BSM limit pricing model, the incumbent does not even have to sink capital or invest in minimum efficient scale to obtain these effects, since hub dominance (enabling the incumbent to provide shuttle services and supporting code-shared flights) is largely based on allocated airport slots: slots that are "grandfathered rights", without requiring capital expenditures on the part of the incumbent!

      An incumbent's commitment to CR systems can provide significant cross-subsidization. Although, being a capital investment, CR systems cannot be used strategically for given city pairs, but only on a network-wide level. In one extreme case, an incumbent could significantly influence the post-entry Cournot equilibrium (at point F, Exhibit 42) if a major stakeholder in the CR system operated only a small route network itself, and if entrants subscribed to a CR system. In this case, and ceteris paribus, post-entry Cournot competition might render the entrant's operations unprofitable. The incumbent would then rather decrease than increase his route network, especially low-density routes with little risk of profitable new entry, in order to maximize the subsidizing effet from CR systems on a per route basis. Price policies would aim at increasing revenues from booking fees (for increasing CR system profits, as well as increasing marginal costs for entrants subscribed to CR systems). Price policies on competitive city pairs would also be oriented towards undercutting the entrant's average costs.

      Finally, for commitment in interlining and franchising agreements, capital investment is not the criterion. The aim is rather to reduce the advantage of low-cost competitors, trying to catch up with their lower marginal costs. Only under optimal circumstances would such agreements yield lower costs for the incumbent's partner: If connecting services, due to the incumbent's hub dominance, allowed for larger aircraft and hence - limited - economies of scale. This approach might delay new entry - and sometimes even induce exit - but it implies that the incumbent actually gives up routes to partners instead of operating them by himself. These code-sharing partners would be expected to apply a Bain-Sylos-Modigliani-like behaviour, even if their economies compared with other small entrants were very limited. Then, prices would remain below the entrant's level of average costs, and output would remain high to exploit small advantages in efficiency. This would mean that the franchisee would need to maintain high load factors with its larger, more efficient aircraft compared with the competitor.


V. Absolute cost advantages


V.1 What are absolute cost advantages?

      As a first reference, again, we need to call on Bain (1956) to define absolute cost advantages. According to him, absolute cost advantages reflect costs in production or distribution that differ between established firms and entrants, independently of the scale of output. Costs, at any comparable scale of operation, would be at a lower level for the established firm than for potential entrants: "...if the prospective unit costs of production of potential entrant firms are generally, and more or less at any common scale of operations, higher than those of established firms..." (Bain 1956, p. 44). Using a graph to depict this relationship, the long-run average cost curve of the entrant would then lie at a higher level than the established firm's.

      In order to explain such continuous differences in unit prices, he identifies two root causes: Either the entrant must use inferior production techniques compared with the established firm. Or he pays higher prices for the productive factors used than the established firm. Of course, both disadvantages can also appear cumulative.

      Having identified the possible causes of absolute cost advantages, (Bain 1956, p. 144) defines the following four categories:

      As such asymmetries between established firms and entrants regarding productive factors or factor prices often involve some form of ownership or control, Bain sees them intrinsically linked to the degree of a firm's integration (p. 148). It is highly significant that Bain sees the third category concerning strategic factor supplies as only relevant for natural resources. Any other strategic factor would obviously be integrated into the entrant's firm, as "...such integration generally seems the better alternative for him, all things considered'. Again, the particular situation with airport slots and hub dominance comes to mind.

      Gilbert (1989) adds that a cost disadvantage arising from inefficient production techniques should not be considered a barrier to entry (Pt.2.2.1). At a minimum, absolute cost disadvantages should be qualified to refer to some factor of production that is denied to the potential entrant (under equal terms as to the established firm). Moreover, he takes opportunity costs into account as well. Considering opportunity costs, apparent absolute cost advantages due to scarce resources, technology, management, etc. might disappear when higher returns from alternative uses were possible. This leaves the possibility for absolute cost advantages due to resources that are specific to particular firms. Since such specific factors may have a lower value in the free market than inside the firm or industry, opportunity costs are less important and absolute cost advantages may arise. Such firm specific resources need not necessarily be mobility barriers in the sense of always being held by incumbents only. 59  Barriers to the mobility of resources are not typically present in the downstream industries that use the scarce resource, but rather exist upstream in the structure of the regulatory authority. It is at these stages where he identifies incumbency rents. Gilbert then concludes the real entry barriers are located at the level of the legal authority that does the licensing.


V.2 The incumbent's strategic behaviour creating absolute cost advantages

      In a logical extension of what was defined by Bain earlier, Gilbert shows that effects identical to those observed with absolute cost advantages could be created by established firms. Such behaviour is always based on the same asymmetries of access to productive factors between the entrants and established firms. Although Gilbert uses the term "endogenously created cost asymmetries"(Gilbert 1989, p. 450), the types of behaviour listed in the following paragraphs can hardly be considered a qualification of what was said by Bain. They are rather a presentation of particular cases, which had not been mentioned as such before. The following paragraphs describe examples of actions created by firms to lever on the typical effects of absolute cost advantages.


V.2.1 Learning by doing

      This concept is associated with the notion of lowering production costs by increasing experience on the job (Lieberman 1984). This notion can be considered as comparable to Bain's access to superior management and working techniques. Such experience-related economies can be the origin of cost asymmetries favouring an incumbent over new entrants. The interesting aspect of such experience-related economies is that the incumbent can maintain this cost asymmetry by simply imitating the entrant's actions. Production decisions are the means to develop such learning effects (increase output, extend life cycles of production, etc.). This, however, implies that learning by doing will not diffuse easily to competitors.

      There is no empirical study to this day that has suggested learning effects in the airline industry subject to higher output, capacity or increase in flights, etc. We assume the business of airlines is shaped by routines that are easily replicated and transferable to other airlines, be it incumbents or entrants. Most airline employees are rather narrowly skilled with highly specific tasks. These job characteristics suggest a rather flat learning curve.


V.2.2 Raising a rival's costs

      Along the lines of Bain's second condition for the absence of absolute cost advantages "...(b) that the entry of an added firm should have no perceptible effect on the going level of any factor price", Salop and Scheffman (1986) argue that behaviour intended to increase industry costs can benefit established firms (despite increasing their own costs) because it causes rival firms to reduce their output. Efforts to increase union wages would figure as part of such behaviour.

      Williamson (1968) examines the Pennington case in the coal industry from such a perspective: Given structural differences in the employment of labour versus capital between big firms and smaller ones, the "manipulation" of wage rates might favour the firm with a low labour ratio by increasing the average cost curve for the high-labour content firm disproportionately. Although this logic was developed from the perspective of driving competitors out of a market, the same rationale may be applied to deter entrants by incumbents whose output is not determined so much by costs involving labour.

      Provided that the incumbent had a lower labour factor in production than the entrant, he would aim to gain output and decrease the entrant's output. This would prevent the entrant from investing in capital to replace the high labour content in his production function and would also lower the entrant's profits. The incumbent would at least maintain his pre-entry output choice later. This can be encompassed by pricing below the entrant's average costs.


V.2.3 Long-term contracts with customers

      Such strategies are based on agreements between established firms and/or customers that limit access to particular markets by actual or potential competitors. 60  They are aimed at limiting the size of a rival's market and increasing the rival firm's average costs if the rival's production technology has increasing returns to scale. One particular case of such contracts is described by Aghion and Bolton (1987, p. 389) with their "optimal contracts between the buyer and the incumbent seller". In this model, an established firm can enter into long-term contracts with customers that specify prices conditional on the entry of a competitor. Although Geroski, Gilbert and Jacquemin (1990, p. 46) consider such strategies are related to absolute cost advantages, we do not follow this analogy for two reasons: (1) demand-reducing strategies are not cost-increasing strategies: cause and effect need to be treated separately; and (2) as Gilbert says, these strategies are based on the assumption of increasing returns to scale for the entrant. Only then will the entrant experience higher average costs than the incumbent. However, as Bain has defined, absolute cost advantages provide lower average costs independent of the scale of output. This second argument reinforces the first one.

      Since such strategies may be relevant for the discussion of frequent flyer programmes, we have chosen - even though they may not be considered absolute cost advantages - to mention them.


V.3 Absolute cost advantages in the airline business


V.3.1 Airport slots


V.3.1.1 Some regulatory background

      Incumbents' airport slots in Europe are commonly referred to as "grandfathered rights". Historically, these former national flag carriers were granted sufficient slots for landing and departure at the respective airports in order to ensure continuous, safe and sufficiently frequent air traffic in a non-competitive environment. This meant that most of the available airport capacity had been created for the former flag carriers anyway. With the exception of fees for landing and take-off, no other forms of compensation for these allocated slots, which de facto represented many features of actual property to the incumbents, had been agreed upon. In particular, there were no payments made by incumbents for leasing or renting such slots. In contrast, excess capacity in airport slots is known to have been sub-leased by incumbents to other airlines (such as charter, etc.). Incumbents always considered these slots "as theirs", even when they were not fully exploited in the past. As a consequence, these "de facto" assets do not appear on incumbents' balance sheets.

      In February 1993, the Council Regulation on Common Rules for the Allocation of Slots at Community Airports took effect. The regulation's main provisions were:

  • Confirmation of the principle of grandfathered rights
  • Creation of a pool of newly created, unused and returned slots of which 50% would be made available to new entrants under certain conditions
  • Slots would be lost if not used for at least 80% of the time for which they were allocated
  • Slots could be freely exchanged between airlines or transferred between routes and types of service.

      The directive focused on entry at the airport level rather than on competition at the individual route level. It also excluded any airline already holding more than 3% of slots at an airport from benefiting from these new entrant provisions, which were supposed to encourage entry. It is noteworthy that the provision did not include a mechanism by which airlines would have to surrender slots to make way for new entrants (Civil Aviation Authority 1993, p. 208).

      The impact of these new policies, however, was not convincing. Civil Aviation Authority (1998, p. 49) puts it bluntly for the typical case of London-Heathrow: "Only five of 14 prospective wholly new entrants at Heathrow began passenger services as a result of the new procedures and only two of these were on intra-EU routes... However, the small number of slots received were used to increase frequency on existing routes and not to introduce new ones...In no case had the regulation resulted in effective new competition from an additional carrier on an intra-EU monopoly or duopoly route from Heathrow".

      We deduce that these provisions failed to allow for entry on a sufficient scale by non-incumbents. As a consequence, different new ways of allocating airport slots are being discussed currently, especially the possibility of auctioning off slot capacity at airports. These new propositions from industry experts, however, have encountered tremendous opposition, mostly based on the rather peculiar role of grandfathered rights. As Civil Aviation Authority (1998, p. 51) puts it: "...the auctioning of slots ab initio would require the confiscation, or at least the phased withdrawal, of substantial numbers of slots from those presently holding them. It seems politically unrealistic to suppose that it would be achievable even if it were economically desirable".


V.3.1.2 Development of slot capacity at major European hubs

      As a whole, airport capacity grew significantly in Europe during the examined period. For Heathrow, for example, the number of hourly slots (on average) increased from 75.9 (1993) to 78.6 (1995) and 80.5 (1998). The following exhibit compares the declared hourly capacities at several European airports in 1993, 1995 and 1998. With only three exceptions, all the airports declare higher capacities in 1998 than in 1995.

      
Exhibit 46: Declared hourly runway capacities for summer busy periods
  1993 1995 1998
London (Heathrow) 77-79 77-81 75-84
Paris (CdG) 76 76 76-84
Copenhagen 74 76 81
Munich 68 70 80
Frankfurt 68 70 76
Paris (Orly) 70 70 70
Brussels 53 60 64
Rome 50 56 63
Milan (Malpensa) 30 30 26
Stockholm 63 66 70
Zürich 60 60 66
Vienna 30 45 54
Madrid 35 30-50 50
Barcelona 28 30 47
Hamburg 40 42 45
Gatwick 36-45 40-47 42-48
Manchester 41 42 45-47
Geneva 30 30 35
Düsseldorf 30 30 34
Milan (Linate) 24 22 32
Athens 30 30 30

(Source: Civil Aviation Authority 1998, p. 46)

      Against this background, congestion at some of the EU's most important airports has worsened over the five years after the introduction of the single market in 1992. The position is now most stark at Heathrow, Frankfurt, Düsseldorf and, more recently, at Gatwick. Already these four airports together affect many of the densest international routes: Of the 44 routes with annual traffic volumes of over 400,000 passengers in 1995, no fewer than 27, including all of the top 10, involved one or more of these four airports. Indeed, these 27 capacity-constrained routes accounted for over 70% of traffic travelling on the 44 densest routes (p. 47).

      As airline incumbents already occupied the majority of such slots at key airports, the entrant found hardly enough airport slots for both departure and arrival at these major European airports. We can infer that the problem of airport congestion may well be intrinsically linked to incumbents' dominance at the major European hubs

      
Exhibit 47: European airports and incumbents' market share in 1995
Airport/Hub Airline Slots,* approximate market share in %
Rome Alitalia 70
Frankfurt Lufthansa 60
Copenhagen SAS 55
Amsterdam KLM 53
Zürich Swissair 50
Paris Air France 45
London (Heathrow) British Airways 42
London (Gatwick) British Airways 28
*Airport slots allocate departure and arrival capacity to airlines. If an airline had a departure slot from 9 a.m. to, say, 10 a.m., it was allowed to use this time period to have a certain number of planes depart from defined gates.

(Source: The Economist.)

      As already stated, obtaining slots at major European airports has proved to be extremely difficult, if not impossible, for potential entrants. As a competitive tool, we can observe that hub dominance will also lever the incumbent's possibility to influence entry by defending his "grandfathered rights" and not necessarily contributing to creating new capacities for entrants. This resulted in some airlines (e.g. new entrants like easyJet and Air Nostrum) switching to close, but smaller, airports such as Luton for London or Ciampino for Rome.

      If a new entrant wanted to expand his output to already established or new city pairs, he could rarely do so for several reasons: First, the maximum number of slots he could obtain was 3% per airport, according to the above EC directive. Second, the few slots that were eventually sold by the incumbents were off-peak hour slots, making increased output more risky, and thus more costly for the entrant. The Civil Aviation Authority (1998, p. 49) writes: "...Little more than 10% of slots initially allocated to new entrants at Heathrow were during the busier periods of the day compared with 80% requested. More than two-thirds were timed either before 7 a.m. or after 9 p.m..." The non-availability of airport slots in most cases brought marginal cost of opening new flights for new entrants practically to infinity, while incumbents maintain their flexibility in managing their pool of capacity. In the rare event that incumbents actually were forced to sell underexploited slots, high traffic at airports like Heathrow or Charles de Gaulle also meant extremely high prices for such slots.

      Moreover, slot allocation even appeared to differentiate between "new entrants". Other European incumbents seemed more likely to obtain new slots than non-incumbents. The Civil Aviation Authority (1998, p. 50) reports: "In summer 1996 airlines which had not operated at Heathrow in the previous summer succeeded in obtaining only 4% of the peak week slots they requested, and by summer 1997 this figure had fallen to 2%. Incumbent 'new entrants' fared rather better and in summer 1996 and summer 1997 they secured about a quarter of the slots they sought..." We can deduce from this that marginal costs for opening or expanding flights for non-dominant incumbents (for example Lufthansa at Heathrow or Air France at Frankfurt) were lower than marginal costs of smaller "new entrants" (e.g. Deutsche BA, easyJet or Virgin).


V.3.1.3 Grandfathered rights and hub dominance: Commitment or absolute cost advantage?

      With incumbents holding such a disproportionate high number of airport slots, we are tempted to compare this with the dynamics of holding excess capacity. Although such slot spaces do not neatly fit the definition of "sunk investment" due to their character as grandfathered rights, they might work in a similarly way. 61  In particular, the marginal cost curves for incumbents to open flights might be distinctly lower than for new entrants. For an incumbent holding the majority of an airport's available slots, it would be relatively inexpensive to increase the number of flights or to change city pairs. A dominant player at a given European hub could relatively easily change the size of aircraft, modify flight frequencies or change between high- and low-density, short- or long-haul flights. For example, if the incumbent were to serve mostly a high percentage of European city pairs, by using small aircraft and by maintaining flight connections many times per day, the effect on airport slots could be interpreted as excess capacity, since the given city pair could also be served less frequently but with bigger aircraft. This would mean that a serious asymmetry for marginal costs of opening flights in Europe existed between incumbents and true "new entrants".

      Exhibit 48 illustrates this asymmetry: As the incumbent with a dominant share already has a fair number of "grandfathered rights" disposable to allocate to any destination he chooses, the marginal costs of adding frequency on existing city pairs or adding new destinations to his network are small. Only from a certain point on, that is for the application of new slots, will it become difficult for the dominant incumbent to obtain them. Thus there is a steeply rising marginal cost curve from that point on.


Exhibit 48: Comparison of marginal costs for new airport slots

      We know that former flag carriers already had their own allocation of grandfathered rights at foreign airports, which was previously negotiated bilateraly between the governments involved. Thus there are low marginal costs on any already existing contingent of slots. The EU directive on slot allocation, which was briefly outlined above, stipulates that any airline with a share of total airport slots above 3% is not to be considered for the allocation of new slots. Therefore, these marginal costs would rise steeply once this market share is exceeded.

      The worst off, as already described, would be the truly new entrants. They are disadvantaged vis-à-vis the grandfathered rights, and, in addition, their chances of obtaining a few of the scarce number of the remaining slots are extremely slim. We can safely assume there would be significant costs in market studies, political lobbying, legal advice and long procedures associated with applying for such slots. Thus, taking into consideration the uncertainty of eventual success, the marginal costs must be higher than for incumbents.

      Our analysis shows that not using available slots is dangerous, even for incumbents: They risk losing them. Also, the marginal cost curves shown increase steeply from a certain point on; with excess capacity they would decrease beyond a certain output and after entry. Airport congestion makes such decreasing marginal costs beyond a certain output unlikely. To stay within Bain's system of classification, we therefore consider the ineffective allocation of slots at dominated hubs in Europe as a case of absolute cost advantages to incumbents and, especially, dominant incumbents. In accordance with Bain (1956, p. 145), we consider such hub and slot dominance a subset of strategic factor supplies, which are...controlled by established firms, so that entrant firms might be denied access to essential materials entirely, or be forced to use inferior materials involving higher costs or to purchase materials from established firms at premium prices." 62 


V.3.2 High wage rates due to unionization

      The view of Williamson (1963) on wage rates as a competitive tool against new entrants needs to be discussed.

      It is a given that labour-related cost functions for new entrants are largely inferior to those of incumbents. New entrants generally have cost advantages of at least 20% over incumbents, especially for passenger services, passenger embarkation and crew costs, as well as administration. If incumbents could coerce new entrants to apply the same high-pay policies as themselves (through joint union memberships, for example), then, indeed, the entrants' cost advantage may disappear. It is difficult to give safe estimates about the capital to labour ratio of incumbents and entrants. If the capital to labour ratio of incumbents were significantly higher than that of entrants, Williamson's approach would provide an argument for incumbents to negotiate higher wages with unions, although increasing their own labour costs by it.

      The relationship between union power and market competition was examined for the period between 1976 and 1994 (Neven and Röller 1996). Their research found significant rent sharing between flag carriers and labour. Combined with government subsidies, such excessive wages were found to "...influence the ability of firms to stay in business, thereby inducing excessive exit " (p. 14). If new entrants were to continue to face such high-pay competition from former flag carriers in the labour market, especially with continued subsidies towards the big carriers, their market presence based upon low-cost competition would seriously be endangered. It is interesting to note that in contrast with the US rationale, which found potential for anti-competitive behaviour in asymmetrical capital-labour ratios between big and small firms, the European context before 1994 appeared to favour outright rent sharing, regardless of "hidden efficiencies" due to the employment of capital investment.

      Another study, by Alamdari and Morell (1997) shows that labour costs per available ton-kilometre were reduced by around 23% for European carriers between 1991 and 1994. Of individual airlines only Iberia and Sabena witnessed rising unit costs during this period. It was found that gains in productivity were offset to a degree by some increase in real wages. The paper also recognizes that the trend towards outsourcing may inflate the productivity improvements. Both studies suggest high wages until 1994 for incumbent airlines, despite apparent progress in overall productivity. Such increased productivity can originate, as Williamson suggests, in a replacement of the labour force by capital investment or by increased outsourcing to other suppliers. 63 

      Within the scope of this paper, we are particularly interested in the period between 1993 and 1997. Both studies mentioned overlap only with the beginning of the period of interest. Between 1993 and 1997, in particular, important initiatives were launched by national carriers to increase productivity as a whole and to decrease labour costs in particular: Their success was not evident. Air France's efforts to cut labour costs were hindered by labour unrest. The airline's proposal to introduce a two-tier pay system for cockpit crew in 1997 caused a number of strikes. 64  Olympic also had problems with labour unrest. Management proposals including a wage freeze, a 45-hour work week, a cut in the number of cabin crew and route reductions prompted staff to stage a three-hour strike in March 1998. The Greek Government said that Olympic's 1994 recovery plan (intended to stretch over five years) had been overturned due to union action and mistakes by management. 65 

      However, other national carriers used this period to significantly reduce labour costs: BA, Lufthansa and KLM are the most prominent carriers that lowered labour costs over the period (partly by lowering wages and replacing crew by younger, less expensive employees). In 1996, BA unveiled a plan that included eliminating 5,000 jobs and cutting GBP 1 billion off its annual costs by the year 2000. In general, we can infer that for the period after 1993 the overall pressure was to cut jobs and to freeze or even lower wages, not to increase them in the way Williamson suggested or as incumbents had actually done before 1993. It is also noteworthy that most employees of new-entrant airlines were not unionized, and possible union membership was still positioned on a national level. As a result, quasi- "collusionary" behaviour between incumbents and airline unions aiming to damage new entrants' cost structures on a European scale was not successful. In addition, airline subsidies were phased out due to EC directives after 1995, so the excesses of rent sharing had to be financed by the carriers themselves. These factors help to explain why the major efforts of former flag carriers in the period in question were aimed at increasing productivity, especially by cutting down on labour costs.


V.3.3 Cross-subsidies from intercontinental routes

      If incumbents were to obtain subsidies from governments, one could interpret them as analogous to absolute cost advantages: No matter how high the prices for fuel, or how inefficient the organization, etc., the government would guarantee debts and would regularly reconstitute the incumbent's equity if need be. Independently of the scale of output, the incumbent might thus use these subsidies as if he had lower factor costs or lower interest rates for procured credit than the entrant. But we have seen that the European Commission forbade government subsidies after 1995.

      The same logic of subsidization on a strictly European scale can be applied to intercontinental flights, especially North American routes. The following exhibit shows the percentage of such intercontinental flights (as measured in millions of revenue-passenger-kilometres) for some of the European incumbents:

      
Exhibit 49: Share of intercontinental flights out of total flights sold in 1996
RPK 1996 SAS Iberia KLM Lufthansa BA Air France*
Intercontinental 7,441 13,873 40,061 44,330 77,800 33,440
Total 19,487 25,931 45,531 58,050 96,163 43,079
% of total RPKs 38% 53% 88% 76% 81% 78%

(Source: compilation of the airlines' various annual reports.) * For Air France only 1992 values available

      We know that long-haul routes, especially to North America are very profitable for incumbents. Based on bilateral agreements between the various nation states and the US, entrants to the European market are usually excluded from such routes (the two major exceptions being Virgin to the US and Lauda Air to Asia). We have already shown that long-haul, dense routes can optimize the efficiency of wide-bodied carriers serving major international hubs, thus lowering average unit costs. This is a second source of super-natural profits on intercontinental routes compared with intra-European traffic. A geographical analysis for the BA group showed that in 1996, 96% of operating profit was made outside Europe, 66  although 65% of turnover was made in the UK and the rest of Europe!

      Such protected profit streams may be diverted to subsidize other non-profitable operations in Europe, and thus work as absolute cost advantages. Obviously, those carriers having the highest exposure to intercontinental flights would benefit the most. As with regular absolute cost advantages, the incumbent could lower his ticket price to drive out entrants from specific city pairs while cross-subsidizing apparent losses with excess profits from intercontinental routes. We would categorize the incumbents as: (1) heavily exposed to intercontinental routes (KLM, BA, Lufthansa, Air France and Virgin); (2) medium exposed to intercontinental routes (Alitalia, SAS, Iberia and Olympic); (3) little or not exposed at all (Sabena, TAP and entrants).


V.3.4 Frequent flyer programmes 67 

      Since the early 1990s, FFPs have spread to the EU from the US. All significant European airlines now have their own FFP or participate in another airline's programme. US experience suggests that once FFPs have been established, it would be extremely difficult, if not impossible, for airlines to abolish them (Civil Aviation Authority 1993, p. 9). In the EU, smaller airlines have been just as quick as their larger competitors to realize the importance of FFPs. Some have sought to overcome their inherent size disadvantage by combining to market joint frequent flyer programmes (such as Virgin and British Midland, and previously Dan Air) or participating in larger airlines' programmes (for example Air UK in KLM's), or both (British Midland participates in SAS's FFP as well as Virgin's).

      Since late 1998, four global alliances have formed, allowing for unified frequent flyer programmes within one alliance. These alliances vary significantly in their composition, as the following exhibit shows, with varying degrees of involvement of European incumbents. 68 

      
Exhibit 50: Frequent flyer alliances in 1997
Alliance Participating airline
Star Alliance Lufthansa, United Airlines, Varig, SAS, Thai Airways, Air Canada
One World British Airways, Quantas, American Airlines, Air New Zealand, Ansett
Wings Alitalia, KLM, Northwest Airlines, Continental
Qualiflyer Group Swissair, Sabena, TAP, Delta, Turkish Hava Yollari, AOM, Austrian, Lauda Air, Tyrolean Air, Air Littoral, ANA, Malaysian Airlines, Singapore Airlines*
Note:
Air France announced its intention to develop a separate alliance along with Delta and other yet to be identified Asian airlines by the year 2000**
*Due to talks between Air France and Delta (see Le Figaro, 23 June, 1999), Swissair and Sabena threatened to withdraw from Qualiflyer and join other partnerships.
** See "Le Figaro" of 22 June, 1999: section BI.

      FFPs have proved popular with passengers, particularly those travelling on business, but less so with the companies who pay for business travel. It is claimed that the plans encourage unnecessary travel, travel at a higher fare than strictly required or travel by a circuitous route so as to use a particular airline. FFPs tend to favour larger airlines at the expense of smaller carriers: In the case of a flag carrier dominant in a particular city, its more extensive network of routes will encourage passengers wanting to collect frequent flyer points to use its services rather than those of a smaller competitor (Civil Aviation Authority 1993, p. 9). Similarly, the larger airline is likely to have more holiday destinations in its route network for programme members to use their points to visit. 69  Following this rationale, the FFPs of Star Alliance, One World and the Qualiflyer Group seem to have both a stronger base with business travellers, and an extremely wide network to cover as many city pairs as possible, for business and holidays alike. In contrast, airlines such as Air France, Iberia, TAP, Olympic and Sabena appear to have had a significant disadvantage as of 1997.

      Frequent flyer programmes encourage passenger loyalty through the award structure. The General Accounting Office (1990, p. 62) states: "Because the award structures encourage passengers to fly regularly on a single airline, a frequent flyer plan helps a well-established airline to discourage its passengers from flying on other airlines that offer new service to the same destinations. The dominant airline at an airport generally offers service to the most destinations and will, therefore, offer participants in FFPs the most opportunities to earn and redeem awards" The same report found, based on a survey of 520 US travel agents, that business customers chose flights to accumulate additional frequent flyer miles more than half the time. It also concluded that FFPs were heavily used and that the airline providing the most flights from a particular city was likely to attract the most frequent flyer participants.

      Indeed, FFPs represent long-term contracts with both customers and other incumbents. They aim to prevent entrants from gaining market share by locking in customers. The levers for effective FFPs appear to be: (1) an award structure that is powerful enough to build customer loyalty (we assume no asymmetries among the given FFPs, ceteris paribus); (2) a business class passenger willing to pay above-normal ticket prices to accumulate bonus miles; 70  (3) a wide choice of destinations; with direct flights preferred; and, consequently, (4) a strong presence at an airport hub. Due to their "global network" approach, however, FFPs may be less effective in deterring entrants from specific point-to-point competition on intra-European short- or medium-distance routes.


Exhibit 50(a): A comparison of marginal revenues between FFP and non-FFP airlines

  • FFPs imply significant administration costs: FFP programs need to be advertised, potential frequent flyer passengers need to be induced to participate in such programmes, FFP passengers need to open an account, these accounts need to be administered with monthly or quarterly account balances sent to the customer, etc.
  • FFPs require, by definition, excess capacity on a broad range of city pairs. This is a clear trade-off between unit yields and unit costs. FFP airlines need to choose larger aircraft if they want to accommodate additional frequent flyer customers who seek to cash in their bonus miles (ergo: marginal unit costs become very small, average unit costs per flight drop). Conversely, these frequent flyer passengers will not add to revenues on such flights (ergo: marginal yield will be zero, average unit yields will drop).


      The fact that business class tickets might provide the necessary yield premium over economy class tickets may render FFPs profitable, though not necessarily profit maximizing. In order to be profit maximizing, the following equation must hold:

      After simplification we get:


      The incumbent increases demand in economy class, while the entrant loses ticket sales (especially for holiday city pairs).

  1. The incumbent's economy fares remain unaffected by this, whereas the entrant is under pressure to lower his prices.
  2. The incumbent's business class ticket prices would need to increase in order to finance the bonus miles plus FFP administration, ceteris paribus. Or, if business class ticket prices remained unchanged, the incumbent's number of business class tickets would need to increase due to FFPs. Otherwise the incumbent would maximize his profits by dropping the FFP altogether.

V.4 Expected post-entry behaviour with absolute cost advantages in the airline business

      As we have shown above, two kinds of absolute cost advantages were not relevant for the airline business between 1993 and 1997: learning effects and unionized labour. Thus, we concentrate on the interaction between airport slots, frequent flyer programmes and cross-subsidization from intercontinental routes, as well as the most probable behaviour incumbents will adopt as a function of these elements.


Exhibit 51: Key features of hub dominance, FFPs and intercontinental routes

      
Exhibit 52: European incumbent's position in terms of hub dominance, FFP and intercontinental service from 1993 to 1997
Airline Hub dominance FFP Intercontinental
British Airways Very strong at Heathrow,
strong at Gatwick
Very strong to USA and Australia Very strong at Heathrow
Lufthansa Very strong at Frankfurt Very strong global network Very strong at Frankfurt
Air France Very strong at Charles de Gaulle, strong at Orly No partner airlines Strong at Charles de Gaulle
Iberia Strong at Barajas No partner airlines Regular at Barajas
SAS Very strong at Copenhagen Very strong global network Regular at Copenhagen
KLM Very strong at Schiphol Strong network to USA Very strong at Schiphol
Alitalia Very strong at Rome Strong network to USA Regular at Rome
Olympic Strong at Athens No partner airlines Low
TAP Strong at Lisbon Regular network through Qualiflyer Regular to Africa, low to North America
Sabena Strong at Brussels Regular network through Qualiflyer Low


VI. Perfectly contestable markets


VI.1 Contestability theory as the basis for empirical testing

      As Baumol, Panzar and Willig (1988, p. 487) write: "Contestability theory offers an analytic framework within which the fundamental features of demands and production technology determine the shape of industry structure and many of the characteristics of industry prices. The theory accomplishes this via a process of simplification; by stripping away through its assumptions all barriers to entry and exit, and the strategic behavior that goes along with them both in theory and reality".

      The theory of perfectly contestable markets describes an equilibrium condition within an industry structure. This equilibrium condition refers to several parameters used in industrial organization and sheds new light on them. Such an equilibrium was defined as follows: "...market is perfectly contestable if an equally efficient entrant is unable to find a combination of price and outputs that enable it to enter and earn a profit" (Bailey, Baumol and Willig 1988, p. 19). In the foreword, Bailey writes:"...the announced prices of a monopolist are sustainable (here synonymous with PCM) if there exists no output-price vector for any potential entrant that can be expected to yield economic profits covering the cost of entry". Contestability is not the outcome of a dynamic game, but rather is defined as a property of equilibrium outcomes.

      Although the realism of contestability assumptions has been questioned (Schwartz 1986; Weitzman 1983), perfectly contestable markets provide convenient benchmarks to ascertain the consequences of barriers to competition (Gilbert 1989, p. 527). In perfectly contestable markets, under equilibrium conditions, prices will equal marginal cost for any product produced in positive amounts by two or more firms. If only one firm exists in a perfectly contestable market equilibrium, total revenues will exactly equal total production costs.


VI.2 The issue of price sustainability

      Baumol, Panzar and Willig (1988) define a perfectly contestable market with reference to the notion of sustainable prices. Implicit in the definition of sustainability is the presumption that capital movements can take place instantaneously, while prices remain fixed. An entrant can test the market and bring capital into production while prices charged by established firms remain fixed. 71  As the entrant's goal is to make a profit, he will only enter, ceteris paribus, if prices exceed costs. In this case, the entrant could undercut the incumbent's price and serve the entire market demand at the new, lower price. Once the incumbent reacts and readjusts his price to drive down the entrant's profitability, the entrant could exit from the market, without loss of investment. Thus, as long as the incumbent's price level offers this opportunity for entrants to enter profitably, prices are not sustainable. Only when opportunities for profitable entry no longer exist can prices be considered sustainable and the market, a priori, to be perfectly contestable.


VI.3 Contestable markets and entry barriers

      "A perfectly contestable market is an illustration of a market without barriers to entry or exit. There is no product differentiation and no cost advantages" 72  (Gilbert 1989, p. 527). It can readily be seen that entry barriers will make it more difficult for an entrant to seize profit opportunities by rapidly entering and leaving such markets. Such entry barriers may be a cause for otherwise unsustainable prices to last. Baumol, Willig and Panzar acknowledge these imperfections as a constraint to market contestability: "...This means that in the absence of other entry barriers, natural or artificial, an incumbent, even if he can threaten retaliation after entry, dare not offer profit-making opportunities to potential entrants because an entering firm can hit and run, gathering in the available profits and departing when the going gets rough".(p. 292).

      It is not the purpose of this thesis to enumerate all conceivable entry barriers and their theoretic relationship to perfectly contestable markets, since we are evaluating a specific industry and the empirical evidence offered within the context of this industry alone. Rather, it is important to note that entry barriers in general may be the key factor accounting for unsustainably high prices prevailing in an industry.


VI.3.1 Contestable markets and fixed costs

      According to contestability theory, fixed costs may make incumbency sustainable. To present the power of fixed costs for sustainable prices, Baumol, Panzar and Willig (1988) use an intuitive example based on the idea that the incumbent could choose between fixed and variable costs in order to produce a certain output.


Exhibit 53: Price sustainability with fixed costs

      With an alternative cost function, which duplicates C but also adds into it fixed costs F, the situation changes fundamentally. With a new revenue function meeting curve C+F at point y*, the new cost function remains above the new revenue function at all outputs lower than y*. There is no opportunity for entrants for profitable entry below y*. The reason is that an increased fixed cost raises the average cost of smaller outputs relative to those of larger outputs. By placing smaller firms at a relative disadvantage, fixed costs make sustainable prices possible for the incumbent (pp. 286).

      However, fixed costs are not necessarily considered entry barriers because they need not prevent optimal welfare performance by the industry (p. 289). Employing a normative criterion of welfare effects to define entry barriers, Baumol, Willig and Panzar follow von Weizsäcker (1980).


VI.3.2 Contestable markets and cross-subsidies

      Cross-subsidies within a multi-product firm ocur when one product produces above-normal profits that are used to compensate for below-normal returns of other products. Prices below marginal costs for a certain product/service indicate the presence of some form of cross-subsidization. This means that, at current prices, users are paying too much for some of the incumbent's services. Consumers would save money on these products/services if a separate firm were to provide only these products/services. Contestability theory argues that "...prices cannot be sustainable if they involve any cross-subsidies..." (Baumol, Willig and Panzar 1988, p. 351). Any product of an incumbent must yield incremental net revenues at least as great as his incremental net costs. Otherwise, an entrant may choose to compete for above-normal-returns by undercutting the incumbent's prices. The entrant would earn more than the incumbent previously did, as it would not be subsidizing other products/services. The incumbent would be left with the below-normal-return products. Therefore, prices that enable an incumbent to cross-subsidize other products/services cannot be sustainable.


VI.3.3 Contestable markets and sunk costs

      Without sunk costs and with identical technologies, the incumbent firm and a potential entrant bear the same cost at each level of output. There is no strategic asymmetry between an entrant and an established firm because each faces exactly the same cost and revenue function. To illustrate further the concept of perfectly contestable markets, we will now touch on their relationship with sunk costs. Caves and Porter (1978) see sunk costs as "the difference in incremental cost and incremental risk" between an incumbent and an entrant. The full cost of an investment to be sunk, already foregone by the incumbent, would need to be made anew by the entrant. The risk of losing this investment is then higher for the potential entrant than the incumbent (Baumol, Willig and Panzar 1988, p. 291). From this perspective, we can understand that the risk of losing unrecoverable capital needed for entry can render markets less contestable.

      This asymmetric risk exposure between incumbents and entrants, however, becomes relevant only in the case of the entrant exiting the market. If the entrant manages to stay in the market sufficiently long, his sunk costs, as the incumbent's before, will eventually become zero (p. 279). This observation is critical to the understanding of the role of post-entry behaviour of the incumbent. If the incumbent were to accommodate the entrant, and if this were known to the entrant, markets could become contestable again because the incumbent's only way to keep an entrant out would be to lower prices to sustainable, that is unprofitable, levels.

      Therefore the importance of the incumbent reacting after entry is evident: "...Sunk costs are not an entry barrier in itself, but permit a wide variety of other influences to affect and to increase the entry barrier." For example, the autors quote economies of scale or "the threat of retaliatory strategic or tactical responses of the incumbent" (p. 290).


VI.3.4 Contestable markets and strategic behaviour

      From the above we infer that the monopolist's response can produce entry costs. The authors write in one proposition: " Where no other entry barriers and frictions are present, either the absence of sunk costs or the prevention of post-entry responses by incumbents are sufficient for markets to be contestable" (p. 301). With different models for entry deterrence, the critical role of the incumbent's countermoves to determine post-entry market equilibrium has already been highlighted outside the scope of contestability theory in previous chapters.

      Baumol, Panzar and Willig (p. 296) constructed a model to establish the relationship between sunk costs, entry costs and welfare, without imposing restrictions on the incumbent's post-entry behaviour. In their findings, sunk costs produced entry costs, which was intuitively explained by their shorter depreciation period during a finite disequilibrium period after entry occurs. Only after such a disequilibrium period was the incumbent allowed to react to drive the entrant out of the market. The possibility of such a reaction by the incumbent accounted for a shorter depreciation period than normally expected (if the capital invested had no salvage value, thus was sunk). But this shorter depreciation period was pointless if the incumbent failed to react against the entrant, because this would extend the shortened depreciation period and thus lower entry costs.

      "In the absence of other cost disadvantages to the entrant, entry costs are zero if either (a) there are no sunk costs, or (b) the monopolist is never permitted to respond" (p. 300). According to this model, both structural (such as entry barriers) and behavioural elements (for example, constantly undercutting the entrant's prices) are needed to produce entry costs within otherwise contestable markets.


VI.4 Perfectly contestable markets and the airline business

      In the early years of contestability theory, the airline industry in the US was often quoted as a particularly typical case (Baumol, Panzar and Willig 1988, p. 279). Planes were considered "capital on wings" and as such not sunk. It was reasoned that their mobility enabled "hit and run" attitudes of entrants, thus forcing incumbents' prices down to sustainable levels. For example, one study for the period 1979/80 showed that potential (rather than actual) competition by trunk carriers "had provided an effective competitive check on the pricing behavior of local service carriers in long- and medium-haul routes during this period" (Bailey, Graham and Kaplan 1991). The authors even claimed that the entire process of deregulating the transport sector in the US was driven by the expectation that "potential competition could adequately protect consumers..." (p. 500).

      Within the context of the airline industry, planes all too obviously were considered the key capital and technology input. Since such capital was fixed, but not sunk, any new entrant could rapidly deploy it on given routes to take the incumbent's profit margins. Once the incumbent reacted with lower prices, the entrant could take his profits and run to new high-margin markets.

      The same authors acknowledge other studies of the airline industry, which conclude "that the industry is less close to the model of perfect contestability than has sometimes been suggested" (p. 498). Call and Keeler (1985) conduct an econometric study by testing the correlation between profits and concentration. They also find significant reductions in established carrier fares, when entry occurs. Morrison and Winston (1987) find that prices are significantly constrained, but only after the number of potential entrants is three. Graham, Kaplan and Sibley (1983) also confirm that route by route prices depend on various influences that lie outside the predictions of contestability theory.

      Influences that may explain the deviation from contestability-based outcomes are found in (1) airport congestion, (2) new entry from carriers with lower cost curves, and (3) at least four carriers operating on the same route (Bailey, Graham and Kaplan 1991). Beyond these three possible influences, Baumol, Panzar and Willig. also quote delivery lags for new aircraft due to technological change and new network structures (p. 501). Without elaborating further on this point, we may assume that new network routings and new, better-adapted aircraft may lower the cost curve in favour of the first airline that can take advantage of them.


VI.5 Predictions of contestability theory concerning the airline sector

      Without the presence of significant entry costs, incumbents would need to maintain prices at sustainable levels to keep entrants out. That is, in the absence of entry costs, marginal revenues would need to meet marginal costs. If the industry leaves a stable, protected environment, as was the case before deregulation, a disequilibrium period would follow with prices going down to sustainable levels.

      For the period following deregulation, as prices move towards sustainable levels, cross-subsidies should also diminish. Specifically, prices in lucrative markets (for example, long haul and dense city pairs) should be substantially lowered, whereas prices in the more costly short-haul and "thin" markets might go up.

      Bailey, Graham and Kaplan (1991, pp. 2) write that "..contestability theory also predicted the emergence of a variety of products, each of which will yield zero economic profit...Products capable of producing zero economic profits, but which were formerly excluded, should now appear." The theoretical basis for this prediction may be associated with economies of scope, which we have not discussed. The issue of product variety was dealt with in chapter "Product differentiation".

      As explained throughout this paper, the empirical analysis will mostly be concerned with the first one of these three predictions that is with price sustainability and the associated entry barriers as well as the kinds of strategic behaviour that influence it. 73  Exhibit 54 (which anticipates the cluster analysis of the following chapter) is sobering: None of the groups observed showed decreases in ticket prices following deregulation in Europe. Pre-deregulation ticket prices at first glance do not seem to have become more sustainable (in the sense of perfectly contestable markets) in the five years after deregulation. More interestingly, this resistance against lower ticket prices is also observable within the lowest fares classes, although to a lesser extent than with premium ticket classes. 74 

      
Exhibit 54: Changes in ticket prices for three flight classes between 1993 and 1997
Cluster   Business class Fully flexible economy Lowest fare
  Mean 37.30% 24.66% 19.95%
  Median 31.76% 20.30% 20.20%
2 Mean 52.35% 27.76% 50.00%
  Median 52.35% 27.90% 50.00%
3 Mean 40.65% 18.24% 0.32%
  Median 24.90% 18.20% 11.39%
4 Mean 40.45% 19.82% 20.43%
  Median 36.25% 19.65% 18.60%
5 Mean -100.00% -100.00% -100.00%
  Median -100.00% -100.00% -100.00%
6 Mean 19.90% 4.87% -37.80%
  Median 19.90% 4.87% -37.80%


VII. Empirical part and conclusions

      The findings in the previous chapter leave us with two possibilities: Either ticket prices were already sustainable during the period before deregulation - a possibility that seems highly unlikely - or entry barriers existed in the period after deregulation that maintained prices above a level which perfectly contestable markets would a priori consider as "unsustainable". The underlying research question may now be repeated: Which barriers to entry contributed most to price sustainability 75  in the years following deregulation (1993 - 1997)? The question, put simply like this, may suggest the application of multiple regression analysis, with changes in ticket prices the dependent variable and various identified variables of airlines for given city pairs the independent ones. However, regression analysis will not tell which entry barriers worked for particular city pairs and which applied more to others. Nor will they indicate if particular entry barriers required other barriers to become effective to keep prices high, as a function of the city pair served.

      The other equally important part of the research, is the question of strategic conduct induced by these entry barriers among different airlines for given city pairs. Along the lines of a firm's conduct following market structure, we are interested in which cases within our sample behaved similarly, and if such similarity may be linked to particular entry barriers present within these cases. Factor analysis, for example, may be one tool to identify the dominant patterns of airlines reacting to deregulation. Cluster analysis, searching for similarities in patterns among different cases, may be another. However, such analysis per se will not tell us which one of these grouped behaviours kept prices sustainable or not.

      Ideally, we seek a methodology to help us to respond to both questions:

  1. How can we form strategic groups as a function of the presence (or absence) of entry barriers within the sample?
  2. To what extent do these various groups influence price sustainability? Which factors within these groups contribute most to such sustained (or unsustained) prices?

VII.1 Research design


VII.1.1 Data and sample selection

      After having tried unsuccessfully to obtain back copies of the OAG from Reed or from travel agencies, I discovered that no university or public institution in Switzerland (including IATA in Geneva) had them listed in their catalogues either. By coincidence, I discovered the library of the Civil Aviation Authority next to Gatwick airport in London. From there, all the raw data required were found and copied. In order to select my sample, it was clear that data needed to be ordered along the lines of city pairs - this was the first major crucial assumption for ordering and checking for completeness of my data. Then, I needed to decide which city pairs should be retained within my sample in order to make a valid statement for pan-European development after deregulation. This proved relatively tricky because preferences of, say, 80% of the passenger traffic in Europe (or 80% of passenger kilometres flown) might have biased the results towards high-density routes alone and neglected lower density-ones, which might still be very relevant for many European member states.


VII.1.2 Variable selection and analysis of raw data

      
Exhibit 55: Summary description of variables
Independent variable Acronym Type Unit of measure Meaning of measure
Average aircraft size dAircra Interval Passenger seats of plane Change in size of plane from '93 to '97
Daily flight frequency dDepd Interval Number of departures per day Change in daily frequency ('93-'97)
Weekly departures dDepw Interval Number of departures per week Change in weekly frequency ('93-'97)
Business ticket dBusine Interval Number of types of business tickets Ticket differentiation within premium class (between '93 and '97)
Season ticket dSeas Interval Number of types of season tickets Ticket differentiation due to season ('93-'97)
Weekday ticket dWeek Interval Number of types of weekday tickets Ticket differentiation due to day of the week (between '93 and '97)
Restricted ticket dFlexibi Interval Number of types of restricted tickets Ticket differentiation due to new restricted tickets ('93-'97)
Special discount dSpecia Interval Number of types of low-fare tickets Ticket differentiation due to lowest fares tickets ('93-'97)
Daily flight frequency Frequ Interval Number of daily departures, if > ;6 Committed to high frequency in 1997
Computer reservation CRS Ordinal {-1;0;1} {no booking via CRS; airline uses CRS for booking; airline is CRS owner}
Code-sharing Codesh Interval Number of daily code-shared flights Influence of code-sharing as of 1997
Frequent flyer programme FFP Ordinal {0;1;2} {no FFP; FFP with average network size; FFP with important network and partners}
Intercontinental flights Interco Ordinal {-1;0;1} {solely intra-European traffic; average presence of intercontinental routes in network; strong presence of intercontinental routes}
Hub dominance Hubdo Ordinal {0;1;2} {secondary airport; presence at dominated airport; dominance at airport}
Dependent variable        
Price Business class dPriceBus Interval Local currency Change in fare between '93 and '97
Price Economy class dPriceHWPX Interval Local currency Change in fare between '93 and '97
Price cheapest ticket dPricelow Interval Local currency Change in fare between '93 and '97


VII.1.3 Estimation


      regression equation would be rather unwieldy, with a true risk of obscuring rather than highlighting drivers for sustainable prices. In addition, the equation's outlined general structure would fail to account for interaction between the categorical variables, a possibility that cannot necessarily be excluded following our assumptions made in the theory part before. We have to look for alternative formulations, even at the risk of increasing the sum of squared errors of a somewhat reduced regression equation. Factor analysis appears to be the proper tool for reducing our set of multi-variates. Then the (reduced) regression equation is:


VII.2 Cluster, factor and regression analysis


VII.2.1 Cluster analysis versus factor analysis

      Cluster analysis seeks to classify data into relatively homogeneous groups according to their similarities. These classes of distinct cases can be visually represented, usually as clusters in two-dimensional space, or as branches of a tree. In this study, we based our similarity measure on distance. 76  although it could also be based on correlation coefficients. With factor analysis, components of variance are the central concept (Karni and Levin 1972). The correlation coefficient is a measure of the variance component common to two variables. Factor analysis can be used to examine the underlying patterns or relationships among a large number of variables and to determine whether or not the information can be summarized into a smaller set of constructs. Factor analysis identifies underlying linear variates that draw out as much sample variance as possible, and usually considers only those variables with "high" loadings. With cluster analysis, all of the variables are considered when measuring similarities and classifying them. Cluster analysis ignores the variance (or distances) of variables with "low" loadings. However, cluster analysis will not interpret how these variables relate to each other.

      As we expect valuable insight from applying both procedures (and later from regression analysis to measure sustainability), we shall first of all form groups (or cases) that describe the various behavioural patterns of airlines serving different city pairs in Europe in the 5 years after deregulation.


VII.2.1.1 Clustering: Preliminaries

      The variables listed above were exported from an Excel formatted spreadsheet into a program specialized for cluster analysis (CLUSTAN). The variable values were not transformed or standardized, a deliberate choice: As Everitt (1980) notes, standardization to unit variance and mean of zero can reduce the differences between groups on those variables that may well be the best discriminators of group differences. Therefore, it is more practical to process the data together and then to perform a single cluster analysis. In this case, we are treating all variables as if they were interval scaled, including the ordinal variables as well. This approach is considered appropriate in the literature (Kaufman 1990, p. 34). It would be far more appropriate to standardize variables within groups (i.e. within clusters), but obviously this cannot be done until the cases have been placed into groups (Aldenderfer and Blashfield 1984, p. 20).

      Then proximities were computed among these variables employing the method of squared Euclidean distance to produce homogeneous clusters with respect to all variables. This Euclidean distance is defined as:

      image077

      where dij is the distance between cases i and j, and xik is the value of the kth variable for the ith case. Despite their importance, Euclidean and other distance metrics suffer from serious problems, among the most critical of which is that the estimation of the similarity between cases is strongly affected by elevation differences. Variables with both large size differences and standard deviations can swamp the effects of other variables with smaller absolute sizes and standard deviations. Moreover, distance measures are also affected by transformations of the scale of measurement of the variables, in that Euclidean distance will not preserve distance rankings (Everitt 1980). In order to reduce the effect of the relative size of the variables, researchers routinely standardize the variables to unit variance and means of zero before the calculation of distance. As indicated before, we have not chosen to follow this path of standardization for a simple reason: We consider the classification in groups as only an intermediary step; our clusters are not the end result of our research, but provide a first and simple depiction of existing groups. Cluster analysis is mostly used as a descriptive or exploratory tool, in contrast with statistical tests which are carried out for inferential or confirmatory purposes. That is, we do not wish to prove a preconceived hypothesis; we just want to see what the data are trying to tell us (Kaufman 1990, p. 37). Although we acknowlegde possible biases due to non-standardized Euclidean distances, we expect to compensate for them in our succeeding steps of factor analysis, when even relatively "small" variables may become highly loaded, and thus significant for sustainable prices. 77  The result of this proximity computation was then clustered according to "average linkage". Proposed by Sokal and Michener (1958), average linkage was developed as an antidote to the extremes of both single and complete linkage. It essentially computes an average of the similarity of a case under consideration to all cases in the existing cluster and, subsequently, joins the case to that cluster if a given level of similarity is achieved using this average value (Aldenderfer and Blashfield, 1984, p. 40).

      The software's integrated "Best cut" function recommended a grouping of all 178 cases into 7 clusters to be significant at the 95% level.


Exhibit 56: "Best cut" proposed clustering

      After re-examining the underlying data, we first found that the t-statistic would hardly change if we were to reduce the number of clusters to 6 (the realized deviates would increase from 0.47 to 0.54 and the t-statistic would only slightly worsen from 6.27 to 7.17). Then we examined the six listed exemplar cases; exemplar cases are those cases that represent most typically the individual cluster (underlined in Exhibit 55 above).


Exhibit 57: Means of the six clusters for each of the independent variables

      One single case cluster attracted our interest: The city pair Manchester-Frankfurt/BA (Cluster 6) appeared somewhat as an outlier, and we thought about combining it with the next closest 78  cluster (which would have been cluster 4), thus reducing the number of our clusters to five. After closer inspection, however, we found that the level of new ticket classes and the use of aircraft well above regular capacity and hub dominance indeed deserved a separate cluster, even if it contained only one single case. We accepted these groups as an important intermediate result for further empirical analysis later on.


VII.2.1.2 Clustering: Resulting clusters

      Cluster 1 (Exemplar case Paris - Lisbon/AF) contains more than half of all cases in our sample. It depicts city pairs that usually involve airport hubs with a strong presence of the particular airline; often, the respective hub is even dominated by this airline. The airline chooses to maintain capacity, that is, leave both flight frequency and aircraft size essentially unchanged. Daily departures remain on a high overall level, indicating dense routes. Ticket differentiation for the particular airline shows only moderately in terms of discriminating more between weekdays/weekends and introducing new Super saver fares.

      Cluster 2 (Exemplar case Brussels - Hamburg/HX) is a small cluster, containing only five cases. It is the only cluster where capacity is reduced (in terms of frequency and aircraft size) without leaving the city pair market. These cases usually involve airports where the airlines' share is only moderate. The airlines align their ticket classes with the "official" IATA coordinated tariffs, thus there is no differentiation in that respect.

      Cluster 3 (Exemplar London - Cologne/BA), another small cluster, contains 10 cases. New service with small, efficient jets was started, providing on average four to five daily connections for a given city pair. Most often, these city pairs involved an airport hub, where the airline already held a relatively strong position. The airlines chose to differentiate their ticket classes from "Official" fares.

      Cluster 4 (Exemplar London - Frankfurt/LH) represents 36 cases and is an important cluster. This cluster describes airlines that opened new service. In contrast to cluster 3, airlines use larger aircraft and lower daily frequencies to provide the output required. More than half of the daily connections involve code sharing with other airlines. These city pairs involve airports where each airline's presence, in general, is not very strong, and airlines do not serve many intercontinental routes within their network. 79  There is no emphasis on differentiation. This cluster probably best represents operational choices made by new entrants.

      Cluster 5 (Exemplar Manchester - Brussels/KL) contains 35 cases. It describes those city pairs that were abandoned by airlines. The airlines' presence at the airports served was very weak. This cluster essentially represents incumbents that unsuccessfully tried to compete outside of airport hubs where their presence was already established.

      Cluster 6 (Exemplar case Manchester - Frankfurt/BA) is a single case cluster. New service was started with high frequency and large aircraft size. BA's particular attention to discriminating between ticket classes is reflected in high scores for ticket differentiation.

      The resulting clusters are shown below, with the exemplar cases representing the most typical case within each distinct cluster. The number in brackets indicates the number of cases in each cluster


Exhibit 58: Resulting clusters


VII.2.2 Factor analysis of measures associated with entry barriers

      Four distinct types of entry barriers were of particular interest: economies of scale, differentiation, sunk costs and absolute cost advantages. As shown before, we assumed these barriers to be partially multidimensional, not unidimensional, and that some entry barriers (especially sunk costs and absolute cost advantages) could not be measured with uni-dimensional parameters. Since I had multiple measures for each construct, we wanted to determine whether the multiple measures were more closely associated to one another than they were to other measures which were intended to measure a different type of entry barrier. The appropriate analysis procedure was to do a principal component factor analysis of all the measures, with varimax rotation, and to allow the analysis procedure to determine which measures loaded together (Kim and Mueller 1978).

      A principal component analysis explains as much of the total variation in the data as possible with as few factors as possible. The analytical goals of parsimony and independence are achieved through this method. However, the first component often represents an overall measure of the information contained in all the variables, and it is difficult to interpret whether the factor is more related to one subset of variables than another. Rotation methods alter the initial factors so that we can more easily interpret the factors, and the varimax rotation method rotates the axes orthogonally. The variables which load highly (near +/- 1) on a factor do not necessarily describe an underlying concept: this task is left to the individual researcher (Kleinbaum, Kupper and Muller 1988).

      If all our measures for each construct loaded together, then the measurement model was well specified and reflected each specific domain of content; but if they did not load together, then we would learn where the discrepancies were and which data were less trustworthy. A scree test, with the minimum eigenvalue set at 1.00, clearly suggested three factors. 80  From the following factor analysis it appeared that some of my measures reflected the constructs as we had anticipated, but other measures did not seem to differentiate between types of entry barriers.

      Whereas Factor 1 clearly reflected differentiation, based on ticket classes, the remaining two factors lumped together different measures from different kinds of entry barriers. However, this aggregation into the two remaining factors is not inconsistent with the theoretical assumptions outlined before: Factor 2 essentially loads highest on capacity-related choices, such as flight frequency and aircraft size. Interestingly, Factor 2 also loads as well on code sharing, an indicator that is likely to be positively correlated with flight frequency. These measures are associated with economies of scale (although frequency and aircraft size would go in opposite directions) and sunk costs (for flight frequency in absolute terms and code sharing). Factor 3 loads high especially on absolute cost advantages (such as hub dominance, intercontinental flights and FFPs). It also shows a high loading on CRS (sunk costs), possibly due to leverage effects that CRS can exercise when combining the three identified absolute cost advantages.


Exhibit 59: Components matrix after rotation


VII.2.3 Regression analysis and entry barrier measures

      Multiple regression analysis is by far the most widely used multivariate technique in strategy management research, since it can be used to examine the relationship between a single dependent variable (in this case, sustainability of prices) and a set of independent variables such as the ones discussed above. Its popularity often results in simple ordinary least square estimations with little regard to testing the assumptions underlying regression analysis or alternative specifications to determine a better fit with the data.

      General specifications

      We applied the regression to selected clusters of city pairs. However, when examined separately, different clusters are likely to have significantly different intercepts and slopes for their respective independent variables. We defined prices as a linear function of a constant Y-intercept and seven regressors, which were selected from our factor analysis due to their heavy loading on a particular factor and due to their relevance for identifying the dominant types of entry barriers:


      with the prefix d describing the differences between 1997 and 1993 in the independent interval variables. For meaningful interpretation of the impact of each independent variable on price sustainability, an intercept term ≠ 0 was not necessarily helpful: A positive Y-intercept already would have included at least some of the price increases that had occurred. In other words, a positive intercept on the Y-axis alone already suggests increases in prices, thus a priori unsustainable prices. As our research question concentrates on entry barriers alone and their respective contribution to price changes, any potential Y-intercept would conveniently cancel out due to our subtraction of two linear equations, which had used an identical term of aj for both in 1993 and 1997.

      Choice of clusters

      Going back to our clusters, we first of all eliminated clusters 5 and 6 for obvious reasons: Cluster 5 described city pairs where airlines had decided to quit service between 1993 and 1997. Again, per definitionem, there was no point in examining price sustainability (variable for price changes equals -1). Cluster 6 was also eliminated, since it contained only one case. This left us with clusters 1 through 4. More clusters then were withdrawn: Cluster 2 initially contained five observations, but needed to be corrected "manually" due to imperfect clustering. After this reassignment of cases, only three cases remained within this cluster. Cluster 3 only contained ten cases, and it was not considered fruitful to run a regression analysis with 7 explicative variables on only 10 cases. An alternative would have been to lump cluster 3 with cluster 4, since both clusters showed city pairs expanding on capacity. However, there were excellent reasons to cluster these two groups apart: By consolidation, mutually opposite signs in ticket differentiation and CRS would have further watered down our difficult analysis to identify the driving barriers in each cluster.

      Testing the assumptions


VII.3 Regression results of incumbent and new entry routes

      Finally, we retain only clusters 1 and 4 for further examination: Both cluster 1 and cluster 4 are the most relevant ones for this research: On one side, there were incumbent routes that presented the typical established operations of former flag carriers. They are represented in cluster 1. Cluster 1 airlines needed to react to the threat of entry 81 . On the other hand, there were routes where new service was started. Both entrants and industry incumbents would serve such markets for the first time and could therefore be considered entrants. Cluster 4 describes these newly served routes.


VII.3.1 Results for incumbent routes (Cluster 1)

      The sample of city pairs within cluster 1 involved those routes where the carrier already had a strong presence at either the origin or destination airport. These routes were frequently served and indicated high traffic densities. One could describe these routes as dominated by former flag carriers.

      
Exhibit 60: Model summary for cluster 1
R R-two R-two adjusted Standard error of estimation Changes in the statistics    
CLUSTER = 1 (selected)       Variation of R-two ddl 1 ddl 2
0.880 0.774 0.754 7.17485 0.774 7 78
0.867 0.752 0.730 4.44081 0.752 7 82
0.900 0.810 0.791 4.26189 0.810 7 70

  1. measures the proportional variance of the dependent variable relative to the intercept as determined by regression. This type of R two cannot be compared with models that include a constant for intercept.
  2. Independent variables: dFlexibi, Hubdo, dAircra, Codesh, dDepw, CRS, InterCo
  3. All statistics are based upon observations, for which CLUSTER = 1.
  4. Dependent variable: PriceBus, PriceHWPX, Pricelow
  5. Linear regression through the origin
  6. Regression by least squares estimate - Weighting by WEIGHT2

      The regression was run on three ticket classes: business class, fully flexible economy and the lowest available fares. Exhibit 64 summarizes the outcome for each ticket class in a particular line. R2 is in a range between 75% and 80%, but cannot be compared with R2 which would include a constant factor. 82 

      The following three exhibits present the coeffcients for price changes in three different ticket classes: business, economy and lowest available fares.

      
Exhibit 61: Regression results for business, economy and lowest fares in cluster 1
  Non standardised coefficients   Standardised coefficients t Significance level Confidence interval at 95% of B
  B Standard error Bêta     Lower limit Upper limit
dDepw 4.043E-03 0.005 0.067 0.873 0.385 -0.005 0.013
dAircra 1.360E-03 0.002 0.055 0.839 0.404 -0.002 0.005
Hubdo 4.957E-02 0.159 0.299 0.313 0.755 -0.266 0.365
CRS 7.251E-02 0.070 0.334 1.029 0.307 -0.068 0.213
Codesh -7.836E-06 0.022 0.000 0.000 1.000 -0.044 0.044
InterCo 2.581E-02 0.145 0.155 0.178 0.859 -0.263 0.315
dFlexibi -3.032E-02 0.008 -0.241 -3.795 0.000 -0.046 -0.014

      a Dependent variable : PRICEBUS

      
  B Standard error Bêta     Lower limit Upper limit
dDepw -6.231E-03 0.003 -0.171 -2.184 0.032 -0.012 -0.001
dAircra 8.328E-05 0.001 0.006 0.083 0.934 -0.002 0.002
Hubdo 0.186 0.094 1.855 1.980 0.051 -0.001 0.372
CRS 3.695E-02 0.043 0.283 0.849 0.398 -0.050 0.123
Codesh 3.296E-02 0.014 0.161 2.386 0.019 0.005 0.060
InterCo -0.129 0.085 -1.278 -1.521 0.132 -0.297 0.040
dFlexibi -7.854E-03 0.005 -0.103 -1.588 0.116 -0.018 0.002

      a Dependent variable : PriceHWPX

      
  B Standard error Bêta     Lower limit Upper limit
dDepw 1.184E-02 0.003 0.315 4.249 0.000 0.006 0.017
dAircra -2.142E-03 0.001 -0.139 -2.129 0.037 -0.004 0.000
Hubdo 2.945E-02 0.111 0.276 0.266 0.791 -0.192 0.250
CRS 1.278E-02 0.047 0.092 0.275 0.784 -0.080 0.106
Codesh -2.746E-02 0.017 -0.110 -1.572 0.120 -0.062 0.007
InterCo 2.347E-02 0.105 0.219 0.224 0.823 -0.185 0.232
dFlexibi -3.576E-02 0.005 -0.456 -7.265 0.000 -0.046 -0.026

  1. Dependent variable : PRICELOW
  2. Linear regression through the origin
  3. Regression of weighted least squares - Weighting by WEIGHT2
  4. Exclusive selection of observations for which CLUSTER = 1

VII.3.2 Interpretation of results (Cluster 1)

      Business Class

      For business class, a single variable representing differentiation has a significant impact on price changes. Unlike our theoretical predictions suggested, the introduction of new ticket classes (here represented by fully flexible tickets) had negative impacts on business class fares. It is not difficult to find a reason for such negative correlations: Fully flexible tickets, even in economy class, provide direct competition for business class, especially on short-haul European routes. These newly introduced and lower priced ticket classes threatened to cannibalize the business segment. However, as shown in the previous chapter, on average, business fares had increased by 37,3%. This means that other factors must have more than compensated for the negative impact of ticket differentiation. Indeed, all remaining six regressors show positive signs, with CRS and Hubdo the most important ones. However, none of these variables is significant on a 90% confidence interval, at least not on a univariate level. 83 

      Fully flexible economy

      Increases in weekly flight frequency show significantly negative impacts on ticket prices, and the extent of code sharing in 1997 shows a significantly positive correlation on the dependent variable. These results must be interpreted in the light of our theoretical predictions: Increasing flight frequency led to higher average costs. Especially on high-density routes as in cluster 1, larger aircraft could have been used instead of increasing flight frequencies. Code sharing was expected to reduce excess capacity and thus to provide lower average costs, which would allow for lower prices. These findings suggest considerable market power: Increasing frequency and lowering prices could deter entrants along the lines of the Dixit model (see IV.4.1). Sharing codes with other airlines and increasing prices indicated market power of both incumbent airlines over such routes.

      By far the most influential independent variable is hub dominance, which is also significant on a 95% confidence interval. Its positive impact on prices had been predicted by theory. The impact of hub dominance on higher ticket prices outweighs the negative impact of more frequent flights by around 10 times (compare the respective b coefficients). Both intercontinental exposure and increases in fully flexible tickets, our proxy for differentiation, contributed to explaining variances from the mean towards lower ticket prices, but failed to be significant on a 90% confidence interval. The negative coefficient for airlines also serving intercontinental routes indicates that for economy class prices may be lowered, possibly to induce passengers to transfer at the incumbents' hubs onto intercontinental routes. This would suggest cross-subsidization on European routes, a clear contradiction to the theory of perfectly contestable markets. This effect is shown to be significant on a 85% confidence interval only.

      The effect of lower prices with economy class tickets through newly introduced ticket classes was shown to be significant on a 85% confidence interval only. Its impact to reduce fares was much smaller than with business class.

      Lowest available fares

      Our third price class that we had examined in cluster 1 contained the lowest available fares for the given city pairs. Most importantly, we note that the independent variables related to size, which we assumed to be relevant for keeping premium fares expensive, no longer played a significant role. Hub dominance, intercontinental exposure and CRS not only did not show any significance, but their coefficients were much smaller compared with other classes, i.e. economy class. It is also noteworthy that intercontinental routes did not appear to cross-subsidize lowest available fares on dominated routes of cluster 1. The absence of such a relationship would correspond to the theory of perfectly contestable markets. In this context of low margin fares, frequency and capacity related variables behaved very much along the lines that had been suggested in the theory part: Increasing aircraft size tends to lower average costs, which may manifest itself in lower prices. More weekly departures do not lower costs: Prices tend to increase. Code sharing, although not significant on a 90% confidence interval, shows a clear tendency to lead to lower prices, probably through lowering average costs. The significantly negative coefficient of differentiation through new ticket classes suggests that new ticket classes had been introduced which allowed a further reduction of lowest fares.


VII.3.3 Results for new entry routes (Cluster 4)

      Cluster 4 describes the situation where new routes were started after deregulation, either by industry incumbents or by new entrants. These city pairs did only exceptionally involve airports where the airline held a strong position. In most of the cases, traffic was started from secondary airports, such as Luton or City airport for London. New service typically was started with around four daily flights for the given city pair (each way). This cluster described an environment that was expected to be more competitive than cluster 1, as the industry incumbent held no city pair-specific advantage compared to any other entrant.

      
Exhibit 62: Model summary for cluster 4
R R-two R-two adjusted Standard error of estimation Changes in the statistics    
CLUSTER = 4 (selected)       Variation of R-two ddl 1 ddl 2
0.997 0.995 0.993 0.34499 0.995 7 27
0.998 0.997 0.996 0.18836 0.997 7 29
0.998 0.997 0.996 0.22371 0.997 7 27

  1. For a regression through the origin (model without a constant for intercept), R two measures the proportional variance of the dependent variable relative to the intercept as determined by regression. This type of R two cannot be compared with models that include a constant for intercept.
  2. Independent variables: dFlexibi, Hubdo, dAircra, Codesh, dDepw, CRS, InterCo
  3. All statistics are based upon observations, for which CLUSTER = 4.
  4. Dependent variable: PriceBus, PriceHWPX, Pricelow
  5. Linear regression through the origin
  6. Regression by least squares estimate - Weighting by WEIGHT2

      As indicated before, a value for R2 as high as the one shown in our model summary should be interpreted with caution. It is mainly due to the fact that we had defined our Y-intercept as passing through the origin of the Y-axis. A control run of our regression equation, where we introduced a constant term into the equation, yielded a value for R2 of around 35%. The following exhibit presents the coeffcients for price changes in three different ticket classes: business, economy and lowest available fares.

      
Exhibit 63: Regression results for business, economy and lowest fares in cluster 4
  Non standardised coefficients   Standardised coefficients t Significance level Confidence interval at 95% of B
  B Standard error Bêta     Lower limit Upper limit
dDepw 2.239E-03 0.003 0.289 0.760 0.454 -0.004 0.008
dAircra 6.064E-03 0.001 3.044 6.297 0.000 0.004 0.008
Hubdo -0.342 0.041 -4.367 -8.360 0.000 -0.425 -0.258
CRS 4.452E-02 0.106 0.525 0.420 0.677 -0.173 0.262
Codesh 4.482E-03 0.013 0.118 0.355 0.725 -0.021 0.030
InterCo 3.918E-02 0.089 0.502 0.441 0.663 -0.143 0.222
dFlexibi -4.908E-02 0.016 -1.069 -3.010 0.006 -0.083 -0.016

      a- Dependent variable : PRICEBUS

      
  B Standard error Bêta     Lower limit Upper limit
dDepw -3.824E-03 0.002 -0.662 -2.463 0.020 -0.007 -0.001
dAircra 2.902E-03 0.001 1.953 5.687 0.000 0.002 0.004
Hubdo -0.131 0.022 -2.252 -6.015 0.000 -0.176 -0.087
CRS 2.791E-02 0.054 0.441 0.515 0.611 -0.083 0.139
Codesh 2.177E-02 0.007 0.771 3.225 0.003 0.008 0.036
InterCo 2.455E-02 0.045 0.422 0.549 0.587 -0.067 0.116
dFlexibi -1.584E-02 0.009 -0.463 -1.793 0.083 -0.034 0.002

      a- Dependent variable : PriceHWPX

      
  B Standard error Bêta     Lower limit Upper limit
dDepw 5.838E-03 0.002 0.903 3.058 0.005 0.002 0.010
dAircra 4.974E-03 0.001 2.992 7.965 0.000 0.004 0.006
Hubdo -0.174 0.026 -2.663 -6.562 0.000 -0.228 -0.120
CRS 0.151 0.069 2.136 2.204 0.036 0.010 0.292
Codesh -1.221E-02 0.008 -0.387 -1.492 0.147 -0.029 0.005
InterCo -0.292 0.058 -4.487 -5.070 0.000 -0.410 -0.174
dFlexibi -8.579E-02 0.011 -2.239 -8.113 0.000 -0.107 -0.064

  1. Dependent variable : PRICELOW
  2. Linear regression through the origin
  3. Regression of weighted least squares - Weighting by WEIGHT2
  4. Exclusive selection of observations for which CLUSTER = 4

VII.3.4 Interpretation of results (Cluster 4)

      Business class

      Three variables showed significant impact on price changes: Aircraft size (positive), hub dominance (negative) and ticket differentiation (negative). As for aircraft size, we found that the use of bigger aircraft (such as a Boeing 737-400 compared with a Fokker 50) was significantly linked, on a 95% confidence interval, to higher ticket prices. This empircal finding supports the theory of higher average unit costs for larger aircraft, if no trade-off is made with flight frequency for given city pairs.

      Economy class

      As with business class, aircraft size increased, hubdominance and ticket differentiation both decreased fares in economy class. These relationships were all significant at a 95% confidence interval for both aircraft size and hub dominance, and at a 90% confidence interval with ticket differentiation.

      Lowest fares

      As with business and economy class, aircraft size increased, hub dominance and ticket differentiation both decreased the price category of lowest available fares (99% confidence interval). Three variables are significant and idiosyncratic in their effect on lowest prices: changes in weekly flight frequency are positively correlated with prices. This corresponds with what we would expect from higher costs being reflected in ticket prices. CRS are significant (95% confidence interval) in raising prices. Only within lowest fares on newly served city pairs were CRS significant for higher ticket fares. Unlike the theory (see IV.3.3 and IV.4.2) suggested, did we not find any transfer of profits derived from booking fees towards CRS stakeholding airlines. CRS appear to contribute to higher ticket fares for airlines that hold important ownership stakes in CRS. 84  The most obvious explanation would be a possible control over distribution channels by incumbents that happen to be the owners of such CRS.


VII.3.5 Synthesis and comparison of the results

      Exhibit 68 synthesizes our empirical findings. It shows all significant correlations between changes in ticket prices and the respective independent variables that represented potential entry barriers. Positive coefficients mean that a higher value of the independent variable increased ticket prices, negative coefficients stand for decreases.

      
Exhibit 64: Summary of findings
  Cluster 1 Cluster 4
Business Economy Lowest Business Economy Lowest
Ticket differentiation - - - - - -
Weekly
frequency
  - +   - +

Code share
  + -   + -

Hub dominance
  +   - - -

Intercontinental
  -       -

Aircraft size
    - + + +

CRS
          +

      We shall now review the impact of the various selected independent variables across all three ticket fare classes within the two clusters and highlight their conformity or non-conformity with the predictions made by perfectly contestable markets.

      Ticket differentiation

      In cluster 1 and cluster 4 the introduction of new ticket classes led to lower ticket prices. This applied across all price segments that were examined, so one can therefore not suggest a price premium that may have been expressed through new ticket classes. If such new ticket classes had better segmented the market and added value to the flight service, differentiation would have allowed for such price premiums. Our empirical data show that differentiation was not a significant barrier to entry. In this sense, pefectly contestable markets are not violated.

      Weekly frequency

      Increases in weekly flight frequency were empirically significant for economy fares and lowest available fares. For lowest fares (in both clusters 1 and 4) the higher costs of operating more frequent flights were reflected in higher prices. This is not surprising, as determining lowest fares is often based upon marginal cost pricing.

      For economy class, increases in weekly frequency would lower prices. This empirical finding confirms the hypothesis made earlier (see IV.3.1.3 and IV.4.1): Increased flight frequencies on certain routes with lower fares would deter entrants. The characteristics of excess capacity and Cournot competition along the lines of Dixit can be confirmed for economy class. With regard to changes in weekly frequency, perfectly contestable markets were not impeded for the segment of lowest available fares. In economy class (for both clusters 1 and 4) markets were not perfectly contestable due to entry barriers and strategic behaviour linked to flight frequency.

      Code share

      As with flight frequency, the cost effects of code sharing were directly reflected in the lowest available prices. Code sharing consolidated operations between two airlines and reduced average unit costs. These lower costs were empirically shown to decrease ticket fares for the lowest available fares. In this respect, we cannot observe any impediment to perfectly contestable markets.

      Within the economy segment, code sharing tended to increase prices. Unlike flight frequency or aircraft size, code sharing could not create excess capacity and would not allow for strategic behaviour along the lines of Dixit. Instead, the argument of market power may provide a valid explanation. In economy class (both clusters 1 and 4), code sharing impeded conditions of perfectly contestable markets.

      Hub dominance

      Dominance at airport hubs presented barriers to entry in the sense of absolute cost advantages. The empirical analysis showed that in cluster 1, hub dominance induced significantly higher prices only for economy class. We may rationalize this observation by considering that margins for business travel are already high, and incumbents have little interest in raising lowest available fares to above-normal profits (signalling low profits to entrants, etc.). Due to the hub dominance of incumbents, perfectly contestable markets did not exist in economy class for cluster 1.

      For city pairs (Cluster 4) newly entered, hub dominance showed significantly and had a strong negative impact on prices. This was explained by the fact that most of these newly served city pairs originated from secondary airports in the city where incumbents held dominant hub positions; thus, hub specific advantages could not be exercised by the incumbent. On the contrary, these secondary airports proved less congested, had less expensive landing fees and, especially, were more accessible for new entrants. This shows that once incumbents had to compete with entrants on the same level, their competitive advantage due to grandfathered rights disappeared and prices had to drop. In this respect, hub dominance of incumbents did not preclude perfectly contestable markets.

      Intercontinental

      As cross-subsidization would be generated within the airline, the principle of profit-maximization suggested subsidizing only the most strategic and competitive routes: In cluster 1, intercontinental exposure served to lower prices in economy class. It is interesting to note that no subsidies were allocated to lowest available fares in cluster 1. For economy class in cluster 1, conditions of perfectly contestable markets were impeded.

      For newly entered markets (cluster 4), competition between industry incumbents and new entrants was more intense and concentrated on the lowest available fares: Cross-subsidies were directed only at the lowest fares segment. Industry incumbents' lowest available fares were not expected to cover costs compared with new entrants who offered a favourable cost structure. Therefore, subsidies were significant if the industry incumbent wanted to stay in business on such city pairs against no-frills competitors. Again, cross-subsidization derived from intercontinental routes prevented perfectly contestable markets.

      As with subsidizing economy class - and not lowest available fares - in Cluster 1, one could expect this price segment, at least partially, to feed traffic into the incumbent's intercontinental routes. Lowest available fares were not structured to provide a feeder service for such intercontinental routes. Therefore, subsidizing such intercontinental feeder services could eventually increase the airline's total margin (compared with using other airlines and then transferring onto the intercontinental route at the hub).

      Aircraft size

      Theoretically, larger aircraft should provide lower average costs than smaller aircraft given a sufficiently high load factor. This reasoning links aircraft size to economies of scale and the expected relationship was empirically confirmed for lowest available fares in cluster 1. In such a low-margin setting, prices would closely follow the actual costs of operations. This relationship accorded with perfectly contestable markets.

      Our empirical findings are the opposite for newly started routes (cluster 4) across all price segments: Here, the use of bigger aircraft increased prices significantly in all price classes. As both entrants and incumbents increased daily frequency in order to pursue dominance on these new routes, many aircraft were operated - often smaller ones. The principle of economies of scale applies hardly in such a setting, where demand is new and preference is given to frequency over aircraft size in order to gain market share quickly. If larger aircraft were used, they would be unlikely to obtain a sufficiently high seat factor if frequency increased as well. This would mean higher unit costs for both incumbents and entrants than would be necessary if excess capacity could be avoided. 85  This behaviour was contradictory to the principles of perfectly contestable markets, but was linked to flight frequency and not aircraft size: If entrants obtained slots, they could cause substantial losses to industry incumbents by operating fewer flights and filling up larger aircraft.

      CRS

      Computer reservation systems were the only barrier to entry we identified that presented technology-driven sunk costs. They had a significantly positive impact on prices only for the lowest fares in cluster 4. Despite careful regulation of the standards of such equipment, CRS owner airlines could still benefit from a "preferred client" status when bookings were made. Although competing offers from some entrants might also be offered through the CRS, the system might still privilege incumbents over entrants. Also, once potential passengers had enquired about flights through CRS, direct offers from entrants (i.e. by telephone or through the Internet) could not easily be made anymore. We observed that control over the distribution channel in the form of CRS precluded perfectly contestable markets for the segment of lowest fares on newly started routes.

      Exhibit 69 summarizes the factors that were empirically shown to have impeded perfectly contestable markets in the European airline industry after deregulation.

      
Exhibit 65: Entry barriers that impede perfectly contestable markets
  Cluster 1 Cluster 4
Business Economy Lowest Business Economy Lowest
Ticket differentiation            
Weekly
frequency
  No PCM     No PCM  
Code share   No PCM     No PCM  
Hub dominance   No PCM        
Intercontinental   No PCM       No PCM
Aircraft size            
CRS           No PCM


VIII. Implications for strategy and public policy


VIII.1 Strategic implications for incumbents

      The following section reviews those barriers to entry that were empirically shown to reduce a market's contestability. Incumbents may reap supra-normal profits by exploiting this lack of contestability in the way they conduct business. However, we distinguish between conduct that exploits existing barriers to entry (Point VIII.1.1) and strategies that are aimed at creating new barriers to entry (Point VIII.1.2).


VIII.1.1 Exploiting existing barriers to entry through strategic behaviour

      Flight frequency

      On routes with medium to high density, the incumbent will prefer more frequent traffic with smaller planes, rather than fewer flights using bigger aircraft. As increasing flight frequency makes markets less contestable on both hub dominated routes and routes that involve secondary airports, the incumbent can pursue this strategy universally. If his cost structure renders the incumbent too expensive, he can leave these routes to franchising partners. The strategic impact is leveraged by lowering prices in economy class in order to deter entrants.

      Code sharing

      For routes on which the incumbent increases flight frequency, code sharing among incumbents may serve as a complement: Instead of an incumbent operating new flights by himself in order to better control certain routes, other incumbents serve the same route in a coordinated manner. The notion of market power allows both partners to raise prices in economy class. For less dense city pairs and for lowest available fares, code sharing often leads to gains in efficiency and thus to lower prices.

      Hub dominance

      Market power at airport hubs is the most important impediment to contestable markets on established routes. Incumbents will be interested in maintaining control of as many available slots as possible at the given airport. If any extension of such airports were planned, it would be in the incumbent's interests to occupy these newly created slots as well, instead of providing an opening to entrants. As suggested above, the physical constraints of airport hubs can effectively be exploited by increasing flight frequency and by extending control over airport slots through code sharing agreements with other incumbent airlines.

      Intercontinental

      The other crucial element for dominating a hub-and-spoke network was intercontinental flights and the excess profits they generated due to near monopolies on such routes. On the one hand, hub and spokes allowed airlines to funnel enough passengers on to high-capacity, long-distance carriers, contributing to high profit margins on such routes. On the other hand, part of these excess profits was used to subsidize economy class on certain spokes. The incumbent was interested in subsidizing those routes where traffic was high and entrants threatened to open service. As slot openings for volume traffic were difficult for entrants to obtain, the scarcity of no-frills fares was not really a threat to incumbents at these hubs. Cross- subsidies could therefore be minimized by concentrating only on economy class.

      Outside of dominated hubs, airport slots were more easily available for entrants. In order to sell capacity (and to gain market share through increasing flight frequency), incumbents had to react to the entrant's no-frills fares. Therefore, cross-subsidies were directed at lowest available fares and not at economy class.

      CRS

      Incumbents were concerned about controlling distribution channels. Computer reservation systems allowed them to leverage on passengers' habits of booking through travel agents. Incumbents should further use this tool and try to persuade no-frills airlines that took only direct bookings (by telephone or through the Internet). CRS were likely to remain a powerful tool, especially if customers wished to transfer to other flights, for example long-distance ones. If no-frills airlines subscribed to CRS, this might give the incumbent the opportunity to further optimize his own network, and might also influence the entrant's price policies (by adding commission fees for the CRS).


VIII.1.2 Creating new barriers to entry

      Beyond the mere exploitation of entry barriers, the incumbent may also attempt to create new barriers to his advantage. We see the potential for the following new barriers:

      Slot allocation

      Because the way the incumbent conducts business is largely enabled by hub dominance, a change in the regime that allocates airport slots is not in the interests of the incumbent. As different studies have suggested, the incumbent will defend this barrier to entry against changes in regulation such as auctioning off all available slots to the highest bidder. Instead of allowing the market mechanism to efficiently allocate the scarce resource of airport slots, it is in the incumbent's best interests to defend the status quo of grandfathered rights. Only if airport capacity were expanded might the incumbent be interested in bidding for newly created airport slots, in order to maintain his market power.

      Bilateral agreements

      The incumbent has a strong interest in maintaining bilateral agreements on air traffic for as long as possible. Such bilateral agreements are the source of the supra-normal profits that can be earned on many intercontinental routes. Bilateral agreements often facilitate code sharing between incumbents since they de facto tend to split up markets between partners.

      If bilateral agreements are dissolved, due to liberalization of air traffic, the incumbent will look for new barriers to create. As long as such agreements persist (as on intercontinental routes), the incumbent can maintain collusive arrangements with his partner airline flying into his hub.

      Additional hubs

      In order to expand their route network and to relieve the dominated hub from congestion effects, many incumbents form additional hub airports, which they dominate. For British Airways this would be Gatwick, for Lufthansa it would be Munich, for Air France Orly or Lyon Satolas. Knowing that sufficiently dense traffic existed for these airports, incumbents might also preempt entrants from developing a home base there by dominating such hubs. In such cities, it may become impossible for entrants to find alternative airports, which would render the advantages due to hub dominance all the more effective for the incumbent.

      Control over secondary airports

      Secondary airports in major cities present ideal airports for new entrants: They are not dominated by incumbents, airport slots are available, landing fees tend to be much lower and airport congestion is less acute. With the customer base as close as for dominated hubs, entrants can better exploit their operational efficiency and cost advantages at such airports. It is in the incumbent's interests to gain influence over secondary airports in order to neutralize these advantages: The local incumbent may, for instance, enter the same secondary airports (as BA did with City airport in London), either with its own equipment or through franchisees. The operator of the dominated hub may be the same as the operator of the secondary airport (for example BAA for both Heathrow and Luton). Pressure from the dominant client or conflict of interest may lead the operator to increase landing fees at the secondary airport as well. Finally, European-wide air traffic control may privilege dominated hubs over secondary airports with regard to navigation.

      Air traffic control

      Air traffic control is a critical bottleneck in air traffic and provides the parties that control it with the opportunity to exploit the limitations of air space. The inefficiencies that result from airport congestion may be either alleviated or exacerbated by air traffic control. If incumbent airlines, or a consortium of incumbents, were to operate air traffic control in Europe, conflicts of interest may appear. Incumbents may tend to privilege their own airlines by making them fly fewer loops before landing or by letting them take off before other airlines' planes on the runway. For no-frills entrants, where operational efficiency and quick turnaround of planes are so critical, having to wait longer on the ground or having to fly an extra waiting loop may become a critical disadvantage. Incumbents, therefore, will have a strong interest in controlling air traffic.


VIII.2 Strategic implications for entrants

      We suggest that entrants will not be able to create entry barriers by themselves. Their main competitive advantage will lie in superior efficiency in operating their planes. Key drivers in the industry that enable superior efficiency include: no-frills service, short-distance routes, highly standardized procedures, choice of only one aircraft type, point-to-point connections, lower labour costs and fees and direct sales channels. However, such superior efficiency can only take effect under market conditions that are not impeded by the identified entry barriers.

      Flight frequency

      In the light of the incumbent's increased flight frequency and use of smaller aircraft, the successful entrant should be concerned about choosing the most economic aircraft (probably a bigger aircraft, such as a Boeing 737) and setting frequency accordingly to obtain high seat factors. For less dense routes, two daily connections may be sufficient, while higher demand may require three or four daily connections. The entrant's pricing policies should fully reflect these cost advantages.

      Code sharing

      The entrant will have made a choice about the right combination between aircraft size and daily frequency. If the route provides sufficient traffic, there is no need to enter code sharing agreements in order to gain market power. If demand proves to be insufficient, entering a code-sharing agreement may be incompatible with the entrant's pricing policy, quality standards, booking procedures, etc. Low-cost entrants risk compromising their competitive advantages if they share codes with other airlines.

      Hub dominance

      Entrants should avoid dominated airport hubs, where there is only scarce availability of airport slots and expansion is difficult. If secondary airports are available, and if its customer base provides sufficient demand, the entrant should develop his routes at such airports.

      Intercontinental

      Its choice of short-haul planes, no-frills service and legal constraints prevent the entrant from serving intercontinental routes. If airport slots are available at the incumbent's hub, the entrant might explore the possibility of feeding traffic into the hub's intercontinental network. Although not the traditional point-to-point service, this market niche may be interesting for the entrant, especially if incumbents were to decide that cross-subsidies for their own feeder operations were too costly. However, the entrant's direct distribution channel is unlikely to provide information on transfer flights and intercontinental connections to passengers. Also, the entrant's no-frills approach will require passengers to check luggage in a second time at the hub airport.

      CRS

      In order to minimize booking fees, avoid any conflict of interest with incumbents owning a CRS, and shield the entrant's network operations from incumbents' monitoring via the CRS, an entrant should not join a CRS. Direct booking with the entrant should be part of the marketing campaign (see easyJet's telephone number painted on the fuselage of its planes). The CRS as a distribution channel is still strongly based on the intervention of travel agents. It should be part of an entrant's strategy to disintermediate that costly layer.


VIII.3 Implications for public policy


VIII.3.1 Liberalization of European air traffic has failed

      As we have tried to show throughout this thesis, the liberalization of European air traffic did not yield the benefits that were put forward by advocates of liberalization: The entry of new competitors was neither pervasive nor lasting; the quality of service did not improve significantly, ticket prices did not come down; and convenient point-to-point connections with larger, comfortable and modern aircraft remained elusive. In addition, bottlenecks in air traffic worsened, with passengers spending record times in the air circling around airports or on the ground waiting for ever scarcer take-off slots to become available.

      The post-deregulation period in the US after 1978 had experienced quite the opposite effects. At the least in the short run, massive entry from new airlines occurred, creating real and serious competition for the major carriers. More than that, the industry incumbents competed against each other in a cut-throat manner, with pricing policies regularly based on marginal costs. Although the industry progressively consolidated, the profound impact of deregulation in the US of lowering ticket prices and enabling true competition on high-density routes cannot be denied.

      It can be argued that gradual deregulation may have its advantages over a total, one-off procedure. However, the objective goal of any liberalization effort must ultimately be to make markets at least contestable, no matter how gradual the approach chosen for deregulation. One may also stress that market contestability is already very much towards the laissez faire end of the regulatory spectrum, when compared with the equilibrium ideal of perfect competition. With perfect competition requiring at least two, obviously non-colluding firms, contestability would tolerate it if only one was presently operating in the market. However, as long as markets do not become contestable, incumbents can act as if entry would not occur, and competition (or contestability in this case) will not deploy its forces to increase public welfare. It is noteworthy that these conclusions, which appear modern and derived from a very topical market inefficiency, have already been formulated by Bain (1956, p. 206): "What is suggested here is that a somewhat more general and comprehensive attention might be given under the law to the preservation of a socially desirable condition of entry to our industries - the preservation of an effective degree of potential competition."


VIII.3.2 Economic barriers to entry replace regulatory barriers

      As we have tried to show in this thesis, entry barriers were at the origin of market imperfections that rendered the different routes less contestable. Before deregulation, new airlines were prevented from entering city pairs, because they were governed by bilateral agreements. Thus regulatory barriers to entry were replaced by new "economic" barriers, created by the more able among the industry incumbents. The strategic behaviour of these incumbents leveraged on existing barriers, which were not subject to explicit deregulation. These barriers were solidified and extended, notably by organizing operations around dominated airports and creating tremendous scales of operation in such a setting. Such strategic behaviour and the economic barriers that it created caused industry structure to change with it.


VIII.3.3 Why privatization will not resolve these market imperfections

      With these market inefficiencies becoming worse in the years after 1998, stakeholders in air traffic, including advocates of liberalization, could not continue to ignore them. Along the lines of what has been said above, it would be surprising to see such stakeholders proposing the elimination of economic barriers to entry to produce contestability in the European market. They may, probably rightly, argue that new entrants at the most important European hubs would probably not reduce welfare losses in the form of airport congestion. In the light of a profoundly changed market structure, it is almost impossible to reverse hub-and-spoke networks now, both practically and economically. Nevertheless, with welfare losses so obvious, these advocates are pressed to propose solutions. They are proposing the same sort of remedy that was the cause of the current situation: further liberalization, especially with regard to air traffic control (Fixing America's airlines 2001).


[Previous] [Next]