1. Hydra as a model system
I. Introduction
The mythology of Hydra
Hydra has the name of Lernea Hydra of mythology. She was the daughter of Ehidna and Tyfoeos. Ehidna was a strange creature being half snake and the other half a woman with wings. The father of Lernea Hydra was one of the Titans having two snakes as the lower part of the body and wings on the human like higher part of his. His shoulders were giving birth to hundreds of snakeheads and he could touch the stars with his arms. The family of Lernea was completed with her strange brothers and sisters, Kerveros, the 4-headed dog and Orthos the 2-headed dog, which belonged to the 3-headed Gyrioenas, the legendary Sfiga and also Chimera. Her uncle Ladonas, the brother of Ehidna was a snake like human with 100 heads ready to regenerate soon after they were removed. Great family for a great era, when strange creatures were the rulers of the Earth, which by the way was the grand mother of Lernea, whose one of the cousins was Skyla, one of the most mysterious creature in mythology. Her morphology was changing according to the story she had to participate in and sometimes she was clonally multiplying herself to mix up her enemies. Lernea Hydra was born in the greatest transitory era for the evolutionary morphogenesis of the ancestors of the human beings.
Our little animal could take other names. For example the one of Forkis, the first king of all of the creatures of the water, who had the ability to change his head and also his body in to many different ways, or the name of the Selini, the very similar monster that Perseas killed. Iolaos, the friend of Iraklis, acted like a scientific advisor, when he decided to find a way to stop the monster from regenerating. He knew, or at least he felt, that something was going on right at the regenerating stumps of the creature. This something he had to stop with fire. Even though the body of Hydra was regenerating heads we never learned if her heads were regenerating new bodies. Her only immortal head we know that is still alive under a rock at the Lerna Lake. Maybe Abraham Trembley who was the first to elaborate experiments on Hydra (Trembley, 1744), had better knowledge resources than what we have and he knew more about the story of the heads of Hydra. I would suggest that our Hydra has only a small similarity with the Hydra of the Lerna Lake and this is for sure not a phenotypic one.
I.1. Hydra as a model system
I.1.1. The Cnidaria phylum in the animal kingdom
Hydra is a fresh water animal that belongs to the Cnidaria phylum. One of the main interests of the Hydra model system relies on the position of its phylum on the animal tree. The diblastic Cnidaria phylum stands as a sister-group of triploblastic animals (Wainright, 1993) and, as such, might illustrate a very primitive form of metazoan organization and physiology.

This phylum is divided into four classes: Anthozoa,Cubozoa, Scyphozoa and Hydrozoa, to which Hydra belongs (Figure 1). The genetic and molecular strategies applied during the last two decades have identified a large number of molecular components that the bilaterians share to regulate their developmental mechanisms. In that view, cnidarian species offer an obviously interesting position for investigating developmental mechanisms already at work in the common ancestors of bilaterians.
One could argue that for such studies we should have better selected phylogenetical lower organisms, like sponges that belong to the Porifera phylum. In order to understand the respective adavantages of cnidarians and poriferans, we present a detailed comparative analysis of the two phyla (Table 1). According to this analysis, Porifera, which are positioned at the basis of the metazoan phylogenetic tree, have some disadvantages compared to Cnidaria:
Animal characters comparative tables are located at the following address: http://www.belmont.edu/Science/Biology/Bio112/Animal%20Characters.html
- Porifera have a less obvious body architecture than Cnidaria
- Porifera do not have a well-defined gastric cavity
- Porifera do not differentiate neural cells
- Porifera are difficult for DNA preparations due the exoskeleton
- Porifera are difficult to be maintained in the laboratory
- Porifera have not been studied for the last 260 years as Hydra has.
Therefore cnidarians, even though hierarchical higher, display many advantages for phylogenetic purposes.
I.1.2. Anatomy and cellular organisation of Hydra
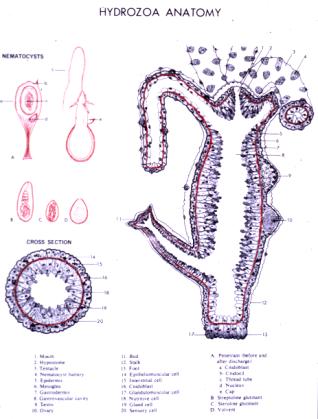
Cnidarians are among the simplest multicellular animals, the first in the zoological rankings equiped with nerve cells and muscle cells. The main characteristics of the cnidarian morphology are as follows:
- a basic radial symmetry
- two layers of cells (diploblastic), ectoderm and endoderm, which constitute the body wall
- an extra-cellular collageneous layer, called the mesoglea, separates ectoderm from endoderm
- a digestive cavity (called gastrovascular cavity) that has a single opening, the mouth
- one to several rings of tentacles associated with the mouth
- phylum-specific cells named cnidoblasts that produce distinctive stinging structures called nematocysts
- a nervous system made of sensory and ganglia nerve cells, that form a simple network with no centralized coordinating center, but a nerve ring in the apical part of some species
- no special excretory or respiratory system, no organs
- an alternance between the polyp (benthic) and medusa (pelagic) forms in the life cycle of scyphozoans and many hydrozoans
- a colonial organisation in most species at the polyp stage (etymologically: many feet)
- an exclusively aquatic and mostly marine biotope (few hydrozoans are found in fresh water)
Hydra lives exclusively as a polyp (Figure 2). The length of the body column varies from 0.5 cm to 1 cm and is composed by 50.000 to 100.000 cells. The apical part of the animal is formed by the hypostome, which is the region surrounding the mouth opening, and a unique tentacle ring. The basal part (or foot) consists of differentiated ectodermal cells that produce some mucous, transiently enabling the polyp to adhere to a substrate.
I.1.3. The epithelial and interstitial cell lineages of Hydra
Two main cell lineages are present in hydra (Figure 2): the epithelial cells that are the most abundant (about 80%) and the interstitial cells. Each of the two cell layers, ectoderm and endoderm, is a single cell deep and contain cells from both cell lineages, with interstitial cells intermingled within the epithelial cell sheet. These two layers are in steady state, due to a permanent renewal of the stem cells in the body column and a simultanous loss of differentiated cells at the extremities. In total 20 to 25 different cell types can be identified (Bode, 1996).
Epithelial cells
The epithelial cells in the body column are continuously in the mitotic cycle (Campbell, 1967) with an average cell cycle time of 3 days (David, 1972), so that the tissue mass of the animal doubles in 3-4 days. The animal remains constant in size due to the continuous displacement and apoptosis of the epithelial cells towards the ends of the body column (Campbell, 1967). This process stands for the 15-20% of the total cell mass loss from the main body column. The other 80-85% of the lost cell mass is used into the developing buds.
The epithelial cells are organized in distinct well-defined regions along the body axis: first according to their cell layer, ectodermal and endodermal epithelial cell lineages being distinct (Takano, 1984); second according to their mitotic and differentiation stages (Holstein, 1991 5). Indeed, the epithelial cells that migrate along the body axis towards the two extremities follow a specific strategy. A map of the mitotic stages and the specific markers expressed by the epithelial cells helped define functional territories along the body column. In the apical region, most of the ectodermal epithelial cells that originate from the body column and reach the tentacle zone, migrate towards the tip of the tentacles where they stop proliferating but very few towards the hypostome. Within the hypostome, most of the ectodermal epithelial cells derive from the outer hypostome where they proliferate while those located around the mouth opening (the inner hypostome) are stacked in G2 (Dübel, 1989 10; Holstein, 1991). In contrast, in the endoderm, most of the epithelial cells found in the head region derive from endodermal epithelial lineage of the body column. They move either towards the tentacles or towards the apex of the hypostome where they stop dividing.
The epithelial cells play a crucial role for several physiological functions: protective and maintaining the osmoregulation when ectodermal, digestive when endodermal, muscular contraction in both layers (Prusch, 1976). In addition, the epithelial cells play morphogenetic roles, namely maintaining the body shape and providing the morphogenetic information along the body axis (Takano, 1984). During budding, the ectodermal epithelial cells evaginate and subsequently differentiate a new head region, with the differentiation of head-specific epithelial cells and the setting up of migration boundaries as described in the adult polyp. Head differentiation occurs in a similar way during regeneration.
Interstitial Cells
The cells, which are distributed among the ectodermal and endodermal epithelial cells along the body axis, belong to the interstitial cell lineage. According to their differentiation stage, these cells can be classified in different groups: first, the multipotent undifferentiated stem cells, that upon mitosis will self renew and produce committed cells, that will finally terminally differentiate in one or the other of the 3 distinct somatic cell lineages. The interstitial committed or precursor cells, stacked in G2, will go through a final differentiation step, giving rise to different types of cells:
- the secretory cells (gland cells, mucous cells) (Bode, 1987)
- the neural cells (sensory and ganglion cells) (Holstein, 1986; Bode, 1990)
- the four types of nematocytes (desmonemes, atrichous isorhizas, stenoteles and holotrichous isorhizas), (David, 1974; Shimizu, 1995)
- gametes also derive from the interstitial cell lineage, with a unipotent intermediate cell type (Littlefield, 1991; Nishimiya-Fujisawa, 1993).
The differentiation and migration of the interstitial cells are continuous processes (Heimfeld, 1984; Teragawa, 1995), in tight crosstalking and crossregulation with the differentiation and migration of epithelial cells (Minobe, 1995; Technau, 1996).
The concomittant differentiation and migration of both cell lineages result in a dynamic typical cellular organisation of the hydra polyp: undetermined, undifferentiated cells are found in the central part of the body column while terminally differentiated cells are located at the apical and basal extremities of the animal. This fine equilibrium between epithelial and interstitial cell lineages sustains the maintenance of the adult polyp structures and supports the morphogenetic events that continuously take place during the life of the animal (Sugiyama, 1993).
I.1.4. Hydra morphogenetic processes
Beside an active maintenance of the patterning in the adult polyp, morphogenetic processes take place in 4 different contexts in hydra : during bud formation, at the time a head or a foot regenerates following either amputation or dissociation of the animal cell layers, and during sexual development (Figure 3).
1- Active maintenance of adult polyp patterning
The presence of morphogenetic activity in Hydra adult tissue was first described by Elena Browne who grafted pieces of tissue onto a host polyp and could induce a complete secondary axis (Browne, 1909).

This experiment provided for the first time some support to the concept of inductive processes, about 20 years before Spemann and Mangold demonstrated the presence of an organizer region in the Xenopus embryo. Later on, the graded distribution of differentiated cells along the axis was observed (Tardent, 1954), and the graded distribution of biological activities was demonstrated by grafting experiments. Lewis Wolpert has linked the two potentials for the formation of head or foot structures with the term of positional value, implying that diffusible extra-cellular signals would account for axis patterning in Hydra (Wolpert, 1972). Coupled to theoretical considerations (Meinhardt, 1974), these data were interpreted in terms of developmental potentials: head and foot formation are supposed to result from two pairs of antiparallel morphogenetic activation and inhibition gradients of extra-cellular signals (MacWilliams, 1983; MacWilliams, 1983). However sophisticated grafted experiments have illustrated the fact that pattern formation can occur in Hydra in the absence of developmental gradients (Ando, 1989).

2- Budding
Several hydrozoans, including Hydra, can reproduce asexually by the production of buds that finally separate from the parental animal as new polyps (Figure 5). In Hydra, budding starts with the evagination of the two cell layers at a low position on the body column that slightly varies between the different hydra species. In Hydra vulgaris, budding normally takes place at a position 2/3 distant from the apex of the animal. The overall process was subdivided in ten different stages (Otto, 1977) that are completed in three days, including the differentiation of the foot.

Figure 5: Budding stages are depicted according to Otto and Campbell, 1977. The development from stage 2 to stage 6 will last about 24 hours. At stage 6, the mouth opening will form and the bud will soon start feeding. The foot will be formed at stage 9 and at stage 10, the bud is ready to detach. It takes around 3 days to reach this stage. Cross-hatching in stages 1 and 2 indicates the endoderm. c: contracted, e: elongated, d: distended with fluid.
The process is initiated with the commitment of interstitial cells to the neural fate (Berking, 1980). This commitment takes place within the presumptive bud tissue one day before any obvious macroscopic modification is observed. Concomittantly, epithelial cells are recruited. During the first day, at least 800 epithelial cells are recruited from both layers of the parental body; their number reaches 5000 cells within 24 hours (Graf, 1980). Then the neuroblasts migrate within the evaginating bud tissue where they start proliferate and differentiate as neural and ganglion cells (Berking, 1980). Labeling of parental cells at the time budding occurs, has shown that migration from the parental body column toward the evaginating bud is quantitatively very important for the 24 hours up to stage 6. At that stage, the first tentacle rudiments will appear, the mouth opening will form and migration processes from the parent toward the bud will cease (Otto, 1977). From that stage the newly formed bud, still attached to the parent can feed. At stage 9, 15 hours later, the foot will form and the new animal can eventually detach after 3 days.
The developmental questions related to budding are the following:
|
- Why is budding occuring in a so strictly defined position along the apico-basal axis? - How can one explain budding in the context of the radial symmetry of cnidarians, considering that symmetry is broken upon budding process? - How can we integrate the establishment of the budding zone together with a graded distribution of the apical-basal axis information and the radial symmetry? - How much related are the mechanisms that lead to the different types of budding observed in cnidarians: asexual budding as in Hydra, budding of the medusa as in Podocoryne, reverse budding as observed in Cassiopea (scyphozoan) where the foot differentiates at the tip of the bud? |
3- Regeneration
Regeneration processes are observed in a large number of animal species (Sánchez Alvarado, 2000) and according to their biological context, these processes are classified either as tissue regeneration or as regeneration of appendages or body parts. The first process does not require a de novo formation of new structures and will not be considered in this work; in contrast the second type of regeneration relies on morphogenetic processes that can be regarded as developmental events taking place during the adult life. This latter type of regeneration was sub-divided into epimorphic and morphallactic regeneration modes according to cellular criteria.
Epimorphic regeneration
Epimorphosis is a term that was originally proposed by Morgan (Morgan, 1905): this first mode of regeneration requires cell proliferation that will lead to the formation of a blastema (Figure 6). The blastema is made of two compartments, the superficial sheet of cells of epithelial origin that covers the entire stump and the underlying layer of cells of mesenchymal origin. The interactions that will take place between these two layers of the blastema will lead to the differentiation of the missing structures. This type of regeneration is common to planarians, gastropods, echinoderms, urochordates, and, limb and tail regeneration in vertebrates (see (Sánchez Alvarado, 2000).
Morphallactic regeneration
The second mode of regeneration has been termed morphallaxis. Morphallaxis involves the recreation of the missing body parts in the absence of proliferation and this mode mostly applies to Hydra regeneration (Park, 1970 ; Cummings, 1984 ; Holstein, 1991). The only process that takes place, at least during the first day, is the differentiation of the pre-existing cells in the region of the injury. Immediately after amputation, epithelial cells of the stumps will migrate and stretch to cover the wound (wound healing phase).
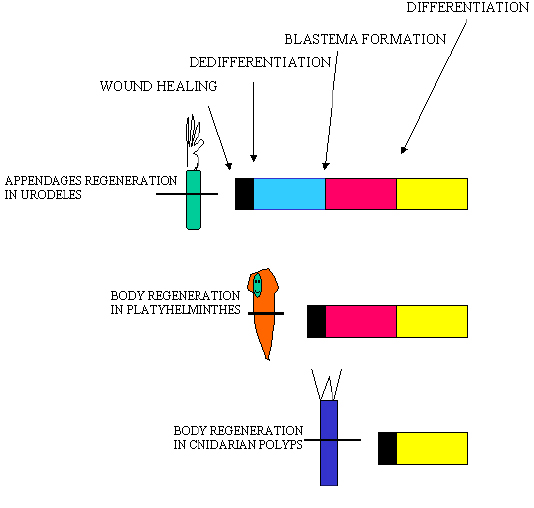
Figure 6: Sheme depicting the various steps required before regeneration is fully achieved in various model systems. In urodeles, the two first phases last about two weeks; in planarian, the blastema appears after one day ; in hydra, the head organizer activity is established within several hours after cutting. Endodermal cells are involved in body regeneration but not in appendage regeneration.
Then grafting experiments have demonstrated that, after a post-cutting inhibition period of a couple of hours, the stump is able to induce the formation of secundary head in the grafted host (Webster, 1966; Berking, 1979; MacWilliams, 1983). Thus, the stump is the place where an organizer activity will progressively get established. This activity reaches a plateau level about 10 hours after bisection, remaining strictly limited to the regenerating tip for the first 15 hours (MacWilliams, 1983).
During the regeneration process, the first events that are detected at the cellular level are the determination and final differentiation of new nerve cells (Bursztajn, 1974; Yaross, 1978). It was proposed that nerve cells are the primary source of signals during regeneration and budding (Schaller, 1989). However nerve cells depleted animals are still able to regenerate, probably thanks to morphogenetic substances produced by the epithelial cells (Schaller, 1980). The signals that control patterning in Hydra remain largely unknown. Peptides, produced by nerve cells as head activator (Schaller, 1989) or by epithelial cells like pedibin, Hym-346 (Hoffmeister, 1996; Grens, 1999) were shown to accelerate apical or basal regeneration respectively. Although early modulations in expression of regulatory genes have been identified during regeneration -for review see (Galliot, 2000), it is not known what signaling mechanisms propagate the head- and foot-inducing signals from their extracellular location to the nucleus. However, appropriate modulation of PKC activity is likely crucial for axis development as evidenced by DAG treatment that leads to multihead animals (Müller, 1989). In vivo, PKC activity increases upon translocation to the membrane during head regeneration and two distinct Hydra genes encoding cPKC and nPKC, show a regulated expression during apical and apico/basal patterning respectively (Hassel, 1998; Hassel, 1998).
4- Reaggregation
Hydra can be dissociated into single cells, which when centrifuged into pellets reorganize into complete animals (Gierer, 1972). Reaggregates first undergo a long lasting process of spontaneous reconstitution: they develop into multiheaded monsters that, after one to four weeks, separate giving rise to one or more normal animals depending on the initial size of the aggregate. Classical experiments with aggregated cells also showed that in the process of self-organization the cells are not equivalent (Gierer, 1972). An immediate cell sorting between ectodermal and endodermal cells will first take place (Sato-Maeda, 1994; Technau, 1992) and terminal differentiation will occur before the polarity is reestablished (Dubel, 1990). Randomly distributed head-organizing centers are detected by 24 hours, providing support for head differentiation in some cases, or disappearing probably by a lateral inhibition process in others (Lee, 1993).
5- Sexual reproduction
It occurs naturally and directly depends on environmental and species specific factors. The polyps are able to differentiate male and female gonads, sometimes both on the same polyp. The embryo reaches the morula stage and falls down from the parent. It will complete its development during the winter, becoming an adult polyp at springtime (Tardent, 1968). There is neither swimming planula or medusa stage in the different hydra species.
I.2. Evolutionarily-conserved developmental pathways
We will describe in this introduction only the evolutionarily conserved developmental pathways that are related to our own investigations. Other important pathways, as the Wnt pathway, are mentionned in the discussion of the results.
I.2.1. The CREB Pathway
The CREB transcription factor
The identification and characterization of the CREB transcription factor resulted from studies on the cAMP regulation as a response to hormonal stimulus (reviewed in (Shaywitz, 1999). Glucagon or Epinephrine exposure lead to an increase in the intracellular cAMP levels, that in turn can enhance the transcription of the somatostatin and other neuropeptides gene (Montminy, 1986; Goodman, 1990).
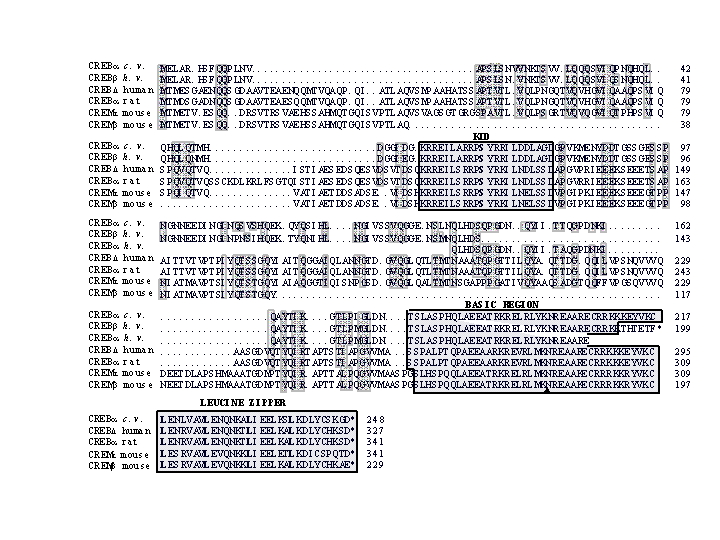
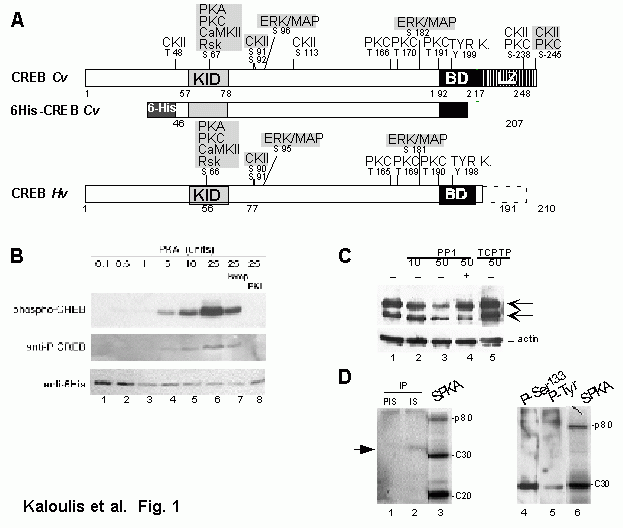
Figure 7: Amino-acid sequence similarity between putative hydra CREB proteins and their vertebrate CREB and CREM counterparts. The predicted 248 amino-acid sequence of CREBafrom Chlorohydra viridissima (cv.) is aligned with CREBb (199 aa long) and CREBa (partial) from Hydra vulgaris (hv.), CREBD from human (Hoeffler, 1988 38), CREBafrom rat (Gonzalez, 1989 148), CREMb and CREMt (Foulkes, 1992 149) from mouse. Grey shaded regions show identities or conservative changes between hydra and vertebrate sequences; points represent gaps introduced in the sequences to optimize the alignment. Boxes contain highly conserved regions that contain the target phosphorylation sites (KID), the DNA-binding region (basic region) and the dimerization domain (leucine zipper). The inverted triangle under the basic region indicates the position of the conserved splice site.
Systematic deletion analysis of the promoter region of the somatostatin gene revealed the functional role of the cAMP response element (CRE) in the elicited response. This is an 8 bp palindromic sequence 5`-TGACGTCA-3` that is critical for cAMP inducibility.
Using CRE affinity chromatography, the CREB protein was isolated as the main CRE-binding protein among PC12 whole cell extracts, migrating as a 43-kDa protein (Montminy, 1987). The human CREB gene encoding a 327-residue protein was isolated (Hoeffler, 1988) and soon after the rat gene, coding for a 341-residue protein (Gonzalez, 1989). Since then, the CREB gene was cloned from evolutionarily distant species as Aplysia, Drosophila and Hydra (Figure 7). DNA-binding is mediated by a basic domain, a lysine and arginine rich stretch of aminoacids. In addition, CREB binds to its target sequence as a dimer (Habener, 1990). Dimerization occurs through an evolutionarily- conserved structural motif located at the C-terminus of the protein, the heptad repeat of leucine residues, named the leucine zipper, just carboxy-terminal to the basic domain. The presence of these two domains places CREB within the family of bZIP transcription factors. The mouse and human genes are composed of 11 exons that encode several isoforms, resulting mainly by the alternative splicing of the 5 first exons of the gene (Hoeffler, 1990; Ruppert, 1992). Functional studies of these isoforms have revealed that according to the domains they encode, they act as either activators or repressors of transcription (Foulkes, 1992).
The CREB pathway
The CREB transcriptional activity is regulated by several phosphorylation events, The among which the phosphorylation of the Ser 133 residue that is located within the kinase inducible domain (KID) (Gonzalez, 1989). KID is loaded with multiple phosphorylation target sites for different kinases, such as calmodulin kinase, protein kinase C (PKC) and protein kinase A (PKA) that are modulated by a diverse array of extra-cellular signals such as hormones, growth factors and neurotransmitters (Shaywitz, 1999). Increases in the intracellular levels of cAMP (Sassone-Corsi, 1998) and calcium (Hardingham, 1998) modulate the CREB activity
As a result of dublication events CREB gene family has several members in vertebrates.
Thus in addition to CREB, CREM (cAMP response element modulatory) and ATF1 (activating transcription factor) are CREB-related bZIP factors (see CREM sequence in Figure 7) that bind to the very same motif and whose transcriptional activities also depend on serine phosphorylation induced by various extracellular signals.
At the biological level, the regulation brought by the CREB transcription factor is critical for a variety of cellular processes, including proliferation, differentiation and adaptive responses. CREB family members are believed to be important for learning and memory (Silva, 1998) and contribute to neuronal adaptation to drugs of abuse (Blendy, 1998). CREB activity is also important for hormonal control of metabolic processes, including regulation of neoglucogenesis by glucagon and insulin. During development, the Drosophila CREB gene is involved in the establishment of the dorsal ventral polarity by regulating genes like Ultrabithorax (Rose, 1997; Eresh, 1997; Andrew, 1997). In mice CREB is required during development for the establishment of a normal repertoire of T-cell lineages (Barton, 1996) and the absence of CREB leads to dwarfism and cardiac myopathy in the adult (Fentzke, 1998 ; Struthers, 1991). In Xenopus, the inhibition of CREB at blastula and early gastrula stages leads to severe posterior defects of the embryos reflected by strong spina bifida, whereas the inhibition of CREB at the beginning of neurulation resulted in stunted embryos with microcephaly (Lutz, 1999).
The CREB pathway in Hydra
Since many years, it was known that treating Hydra with cAMP could affect regeneration (Wolpert, 1974). In addition, it was shown that cAMP treatment could mimic the affect of HA during nerve cell differentiation (Holstein, 1986; Fenger, 1994).

Figure 9: a) Hydra vulgaris nuclear extracts (NE) prepared 4 and 28 hours after cutting. This species regenerate both, apex and basal disk. b) Hydra oligactis NE prepared 2, 4 and 24 hours after cutting. This species is slower for apical regeneration and is deficient for basal regeneration (less than 5% of the animals will regenerate a basal disk). C1, C2: uncut controls.
By testing the DNA-binding activity of Hv nuclear extracts (NE) prepared at various times during regeneration onto the CRE, a significant modulation of the DNA-binding activity was observed early during regeneration (Galliot, 1995). This band-shift analysis was also performed using a species that is deficient for foot regeneration, Hydra oligactis, and no modulation of DNA-binding activity was observed in the absence of regeneration (Figure 9). Therefore these modulations were likely not linked to the wound healing response but rather specifically induced at the time regeneration is initiated. In addition, slight differences in the CRE-binding complexes were observed according to the species. These results suggested that the putative hydra CREB transcription factor was implicated in the regulation of regeneration in Hydra. Thus Gallliot et al. (1995) screened Hv and Cv cDNA libraries with a guessmer oligonucleotide corresponding to the conserved basic region and identified in these two species a single CREB gene where both the bZIP and the KID domains were highly conserved (Figure 7).
I.2.2. The Hedgehog (Hh) signaling pathway in the evolution
Hedgehog (Hh) genes encode a family of signaling molecules involved in a variety of developmental processes in both vertebrates and invertebrates (Hammerschmidt, 1997). In Drosophila, Hh patterns the body segments, the wing, leg, eye imaginal discs and regions of the fly brain, either directly, either through the recruitment of other signaling molecules such as decapetaplegic (Dpp), and Wingless (Wg) (Figure 10). In contrast to the single Hh family member in the fly, there are three Hedgehog members in mammals: Sonic Hedgehog (Shh), Indian Hedgehog (Ihh), Desert Hedgehog (Dhh), this latter one likely representing the most ancestral Hh gene in vertebrates (Kumar, 1996; Zardoya, 1996).

Figure 10: In Drosophila (a,b) Hedgehog (HH) activates the Wingless (WG) pathway at the anteroposterior boundary of the abdominal segments (a) and the developing imaginal discs (b). In vertebrates (c,d), HH participates in the determination of the antero-posterior axis of the developing limb bud (c) and the budding process during mouse lung morphogenesis (d).
In vertebrates, Shh activity at the midline of the gastrulating embryo, patterns the overlying ventral neural tube and adjacent ventral somites, and participates in the development of left-right asymmetry. In addition, Shh has a polarizing activity in the limb and regulates morphogenesis of a variety of organs, including the eye, hair, and lungs. Dhh and Ihh play more restricted roles: Dhh acts in the regulation of spermatogenesis and organization of the perineurium (nesting peripheral nerves); Ihh acts for the coordination of the proliferation and the maturation of the chondrocytes during development of the endochondral skeleton (St-Jacques, 1999). Hh, as well as Wnts and BMPs signals act as a morphogen to induce distinct cell fates at specific concentration thresholds and appear to have both short and long-range activities (Christian, 2000). To date, the only transcription factors shown to be directly downstream of Hh are the zinc-finger containing proteins Cubitus interruptus (Ci) and Gli, in flies and vertebrates respectively (Matise, 1999). The interest in this pathway has taken on added importance with the identification of mutations in Hh pathway genes, including Gli genes, in several human developmental disorders and cancers.

I.3. Aims of this study
For this study we addressed and tried to answer the following questions:
Which could be the earliest modulations detected at the molecular level that could be identified during regeneration and budding?
What could be the extracellular modulator(s) of these early responses?
How similar are these molecular mechanisms between budding and regeneration?
How is patterning established along the Hydra body column at the molecular level?
Can the data we observed at the molecular level be reconciled with the proposed extracellular gradients that would support Hydra pattern formation?
Recent data lend some support to the putative role of the CREB pathway during regeneration (Galliot, 1995; Galliot, 1997). Thus we decided to study in more details CREB regulation at the transcriptional and post-translational level.
The evolutionary conservation of the Hh gene between arthropods and vertebrates implies that this gene was present in their common ancestor, thereby suggesting that the corresponding signaling pathway may have an old phylogenetic history. In addition, Hydra polyps are well known for both their capacity to regenerate and the presence of specific morphogenetic activities. For these reasons, we looked for a potential Hh gene in the Hydra genome and the conserved transcription factor Gli/Ci, which mediates Hh signaling in both vertebrates and arthropods. In the course of these clonings, we isolated by chance a Kazal-repeat containing gene (Iolaos) that displays similarities with the Agrin/Follistatin-related genes. Having in hands these genes, we have investigated their developmental regulation at the gene expression level in the adult polyp, during budding and regeneration.
In order to address these questions we carried out advanced biochemical and molecular biology techniques: RT-PCR, Southerns, in-situ whole mount hybridization, whole mount immunodetection, in-vitro production of proteins, Westerns, in-gel kinase assays, solid kinase assays.
II. Experimental procedures
II.1. Culture of animals and regeneration experiments
Standard cultures and regeneration experiments were performed as described in appendix I.We culture in the laboratory the Chlorohydra viridissima wild type (Cv wt) species since 1996. These polyps were obtained from a teacher, Mr Nicolet, who collected them in a pond located in the Canton of Geneva. To analyses the influence of the light cycle onto the budding rate, 120 Hydra magnipapillata (Hm) adult buds were mechanically detached from their parents and dispatched in two boxes filled with 1 liter of hydra medium. These two boxes were kept in an incubator providing a permanent light with two lamps at stable temperature (19-20° C). One of the two boxes was enclosed in a light-safe container within the incubator. These cultures were kept under these conditions for 2 months per experiment and the animals were fed every 2nd day and counted once every 2nd week. To analyse the influence of the light cycle onto the regeneration rate, 200 mechanically detached adult buds were kept in an incubator at 19-20C either under continuous light or under continuous dark for 2 weeks. Then, the budless polyps that were cut at mid-gastric position, regenerated either under total dark or under continuous light exposure at 17°C. The appearance and number of tentacle buds on the stumps was recorded after 56 hours.
II.2. Grafting and in vivo labeling
For the grafting experiments, the Holland strain of Hydra vulgaris, kindly provided by Prof. Dick Campbell (Irvine, USA) was chosen for its large polyp size. Dissecting and grafting were performed with a simple lancet on animals starved for at least one day. The manipulations of the grafts had to be very fast, otherwise they were rejected by the host. Hydra cells either from the graft or from the host were labelled by injecting 20 hours prior manipulation fluorescent beads (Polysciences Inc. ref: 17154) into the gastric cavity (Technau, 1992).
II.3. Whole-mount RNA in-situ hybridization
The in-situ hybridization procedure was performed as in (Gauchat, 1998; Grens, 1996) except that the RIPA treatment was replaced by a 2 µg/ml proteinase K (PK) treatment for 10 minutes at RT for the detection of the Iolaos transcripts and the Hedgehog transcripts on the grafted animals. A heating step at 80°C for 20 minutes, was added after the PK treatment in every other case (see the description of the riboprobes in Table2).
II.4. Histology
Animals submitted to whole-mount mRNA in-situ hybridization, were selected after digoxigenin detection and processed for sectioning and further microscopic analysis of the CREB expressing cells as described in (Mokady, 1998). After fixation in 3.7% formaldehyde and complete dehydration through graded alcohols to 100% alcohol, animals were infiltrated for at least 4 hours up to ON with the JB-4 resin with 3 changes of the solution (JB-4 Embedding Kit -Polysciences, Inc-) according to the supplier instructions. 5 µm sections were performed using a Leica 2045 microtome equiped with carbon tungstene blades, transferred onto a glass slide, mounted with 90% glycerol and pictured on an Axiophot microscope under Nomarsky conditions.
II.5. Whole-mount immunodetection
The rabbit polyclonal antiCREB antiserum N° 81524, 4th boost was used at a 1/1500 dilution (Galliot, 1995). Detection of the CREB expressing cells was performed as in Gauchat et.al 1998.
II.6. Cloning procedures
The cloning of the Hv-Gli, Hv-Iolaos genes and the Hv-CREBd isoform was performed on cDNA templates that were prepared as follows:100 Hydra vulgaris either total (Gli, Iolaos) or head-regenerating (one hour after mid-gastric bisection, Hv CREBg isoform) were homogenized in a 500 ml downcer in the extraction buffer provided with the mRNA isolation kit (Pharmacia). mRNA was prepared according to the instructions of the supplier and eluted in 20 ml Millipore water. 5 ml were used to produce the cDNA with the Superscript II reverse RNA polymerase (Gibco-BRL). For the final PCRs, 1/40-1/20 of the single strand cDNA provided the template of a 25 ml reaction.
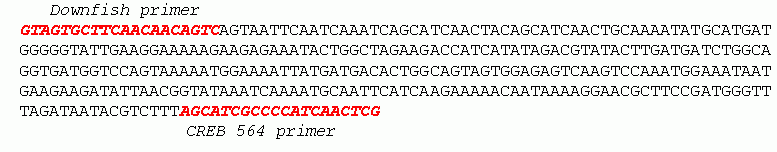
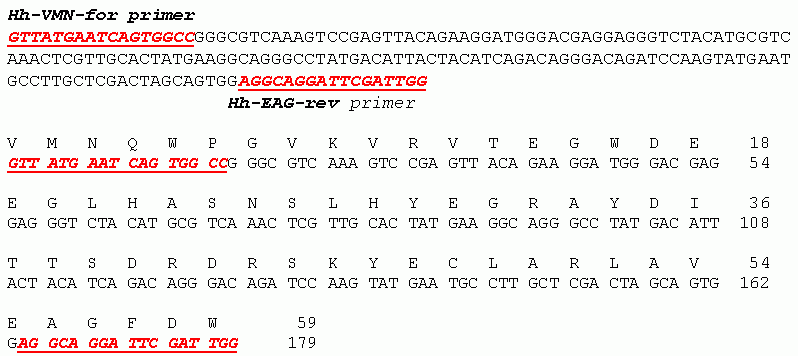
Hv CREBd isoform cloning : Based on the genomic structure of the CREB gene (Galliot, 1995), two primers, CREB-564 and CREB-downfish, located in two different exons were designed and used on cDNA prepared from head-regenerating Hv mRNA for PCR. PCR products were electrophoresed on a 2% agarose gel and the CREBd isoform (336 bp) was isolated from the gel and cloned into the pCR-Script SK(+) vector (Stratagene). Hedgehog cloning was performed by the use of PCR on 800 ng Hv genomic DNA using two primers, HH-VMN-for and HH-EAG-rev, 32x and 128x degenerated respectively (sequences kindly indicated by Juan-Carlos Izpisua-Belmonte, see Table 3). The annealing temperatures varied between 42°C and 45°C. The profile was as follows: 3 min 94°C, 15 sec 94°C / 40 sec 42°C-45°C / 40 sec 72°C for 30 cycles, 5 min 72°C. The expected product size was around 200 bp. The part of the gel corresponding to the expected size was isolated and directly used as a template for a reamplification PCR with the same pair of primers. The product was electrophoresed once more, and a 180 bp band was eluted with the help of the Jetquick Gel Extraction Kit (Chemie Brunschwig). The eluted product was cloned as above and the sequences were analysed with the help of the BLAST program. The Hv Gli cloning was performed as following: two Gli primers (Gli-for2 and Gli-rev2, 32x and 128x degenerated respectively) corresponding to highly conserved regions of the Gli/Ci transcription factor family were used for a gradient PCR (profile: 3 min 94°C, 15 sec 94°C / 40 sec 49°C-60°C / 40 sec 72°C for 30 cycles, 5 min 72°C) that provided a 240 bp clean band at the expected size. This band was isolated from an agarose gel, cloned into the pCRII-TOPO vector (Invitrogen), sequenced and anlysed with the BLAST program. Hv Iolaos cloning: Two Gli primers (Gli-for1 and Gli-rev1, 144x and 64x degenerated respectively) corresponding to highly conserved regions of the Gli/Ci transcription factor family were used for a gradient PCR (profile as above) that provided a 500 bp clean band at the expected size. This band was isolated from an agarose gel, cloned into the pCRII-TOPO vector (Invitrogen), sequenced and analysed with the BLAST program.
*that were used for the cloning and the RT-PCR analysis of the different Hydra vulgaris (Hv) genes described in this work. N=A+c+T+g, R=A+g, Y=c+T, M=A+c, K=T+g, S=c+g, W=A+T, H=A+T+c, B=T+c+G, D=A+T+g, V=A+c+g.
|
Freeze and cut experiment: (see appendix I) Whole cell extracts (WCE): (see appendix I) Purification of CREB-binding proteins: (see appendix I) In gel kinase assay (GKA): (see appendix I) Solid phase kinase assay (SPKA): (see appendix I) Phosphatase assay: (see appendix I) Western analysis and antibodies: (see appendix I) Immunoprecipitation (IP): (see appendix I) |
III. Results
III.1. CREB Regulation in Hydra
III.1.1. Early temporo-spatial regulation of a CREB-binding kinase during hydra regeneration
As post-translational regulation is critical for the modulation of the CREB transcriptional activity. We have analysed among CREB-binding proteins the kinase activities that show some regulation during early regeneration, at the time organizer activity is establishing in the stump. One of them, a p80 kinase identified as a cPKC isoform, showed, as early as 20 minutes after amputation, an enhanced activity in the head-regenerating stump but a repressed one in the foot-regenerating stump. However, this regulation was not observed in the regeneration-deficient reg-16 mutant. In addition, when regeneration was slowed down by the presence of high levels of endogenous factors released upon bisection, this regulation of the p80 kinase was found inverted. This immediate but differential regulation of the p80 kinase implies that the head- and foot-regenerating stumps sense and respond differently to the released factors at the time they establish their organizer activity. These results are presented and discussed in Appendix I (Kaloulis et al., submitted manuscript).
III.1.2. Temporo-spatial regulation of CREB expression
CREB expression in the adult polyp
In the adult polyp, CREB is predominantly expressed in the head region, with an expression restricted to the endodermal layer of the hypostome (Figure 12). In the hypostome, the endoderm is folded into wedges that protrude into the gastric cavity. Correspondingly, the gastric cavity is reduced to a canal with branches that separate neighboring wedges or protrusions. The endodermal cells located in the hypostome are of two types, either endodermal epithelial cells or mucous cells that derive from the interstitial lineage (Bode, 1996). The epithelial cells occupy the whole depth of the endoderm, extending from the base of the tissue layer, next to the basement membrane, to the edge of the tissue layer facing the gastric cavity. The mucous cells are located among the epithelial cells on the outer edge of each protrusion facing the gastric cavity. According to the microscopic sections, CREB is expressed within the epithelial cells that constitute the endodermal wedges of the hypostome (Figure 12c). This expression pattern suggests some function for CREB in the maintenance of the hypostome region. Beside this apical expression, we could detect in some cases a weak expression in the peduncle zone (Figure 12a).
CREB expression during budding
During budding, the CREB transcripts were detected as early as stage 2 in few ectodermal cells of the emerging bud (Figure 12d). In few budless animals, we could detect a bud spot (not shown), implying that CREB expression is actually initiated before stage 2. At subsequent stages, the expression was detected mainly in the endodermal cells of the growing bud (Figure 12e, f).
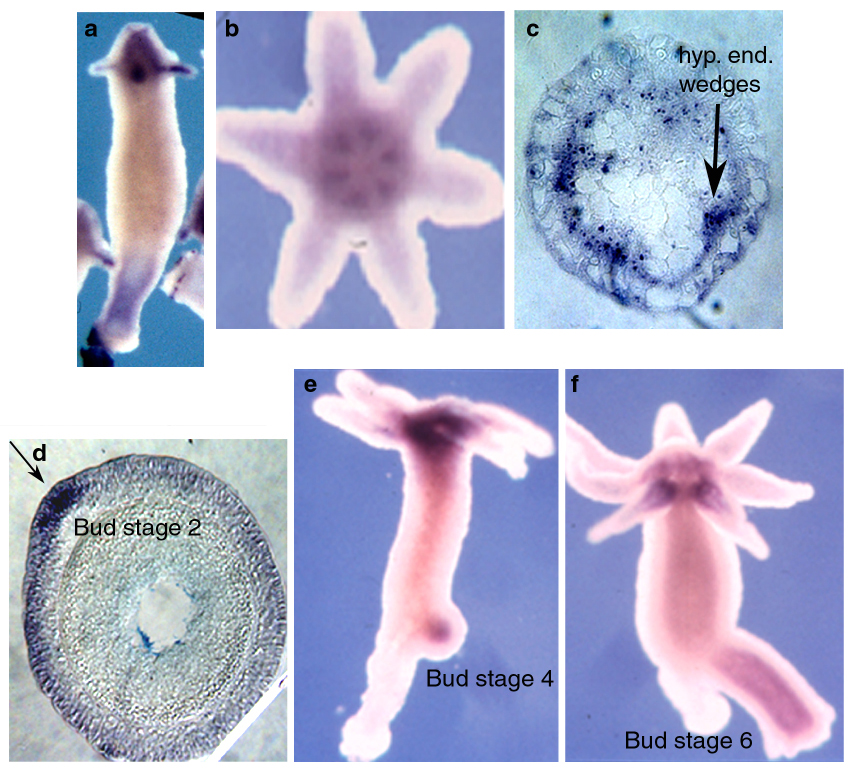
Figure 12: CREB is expressed: a) at the apical and basal structures of the young budless polyps, a, b, e and f) the expression was detected in endormal cells of the hypostome, b and c) the gene is expressed very early during budding at the ectodermal tip of the emerging bud (stage 2) and later (d, e and f) in the endoderm of the (stages 4 and 6) buds.
Thus during budding, CREB shows two distinct and subsequent waves of expresion, first and transiently in few ectodermal cells of the emerging bud and later in endodermal cells of the developing bud.
CREB expression during regeneration
In Hydra vulgaris, CREB expression was detected at the regenerating apical and basal stumps, already within the first hour following mid-gastric section, mostly in the ectodermal layer (Figure 13a). At 4 hours, CREB expressing cells were found exclusively in the endoderm of head- and foot-regenerating stumps, displaying a graded distribution at least in the head-regenerating stump. Later on, from 8 until at least 16 hours post-amputation, the CREB transcripts were localized in both ectoderm and endoderm (Figure 13c,d). This transient ectodermal expression at least in the head-regenerating stump, shows a sharp boundary of its domain that remains stricty limited to the stump region. At 24 hours, the stump-specific ectodermal expression is not detected any longer while a weak endodermal expression is still present (Figure 13e).

Figure 13: CREB transcripts were detected in apical and basal stumps already at the 1st hour after mid-gastric section (a), in endodermal cells (arrowheads) of the apical and basal stumps at the 4th hour of regeneration (b) and, in both ectodermal (arrows) and endodermal at the 8th and probably the 16th hour. At subsequent stages (d, e f), the gene was mostly expressed in the endodermal cells of the basal stumps. Lower panel : dissected polyps along the apicao-basal axis ; the apex is oriented upwards.
At 36 hours, the endodermal expression is clearly enhanced in head-regenerating stumps, few hours before the first tentacle rudiments are detected (Figure 13f). Finally, at 48 hours, the expression pattern is very similar to that observed in the adult polyps (Figure 13g). During the course of foot regeneration (the apical half), the adult head expression pattern did not show any significant modulation. CREB can be considered as:
- an immediate gene (turned on during the wound healing phase), an early endodermal gene (at the time, head-organizer activity is establishing in the stump)
- an early/late ecto/endodermal gene (between 8 and 20 hours post-amputation)
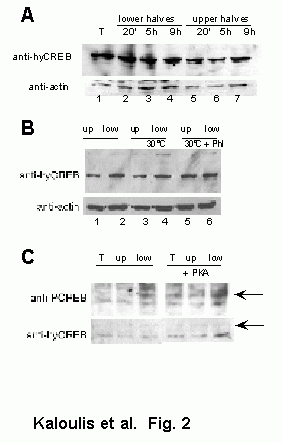
- a late endodermal gene (at the time head morphogenesis terminates).In order to complete this analysis, we analysed the regulation of the CREB protein by carrying out whole-mount immunodetections on total, budding and regenerating hydra. The protein was present from the early, until the late stages of budding mainly at the presumptive apical structures (Figure 14a). During regeneration, the protein was expressed as soon as one hour postcutting in the head-regenerating stump but at a lower level in the foot-regenerating stump while CREB was present in the head region of this half (Figure 14b). Later, at 8 hours, CREB was localized at both regenerating ends, plus at the head region of the upper half (Figure 14b). These observations are in agreement with the observed localization of the CREB transcripts and suggest that CREB regulation is involved in the molecular processes that underly regeneration and budding.The whole mount immuno detection was completed with a Western analysis of the CREB expression during regeneration (Figure 14c). This analysis showed that the CREB protein level, when compared to that detected in the intact control animals, was up-regulated during the first 20 minutes of apical regeneration, and for both, apical and basal regeneration within the first hour following bisection. Later on the level of CREB protein decreased drastically during basal regeneration, reaching the levels of intact animals, but remained maximal during apical regeneration, at least during the first 9 hours of regeneration. The whole mount immunodetection indicated similar results concerning the up-regulation of CREB protein levels during the first hour of regeneration.
However, several hours after bisection, we did not scored this dramatic
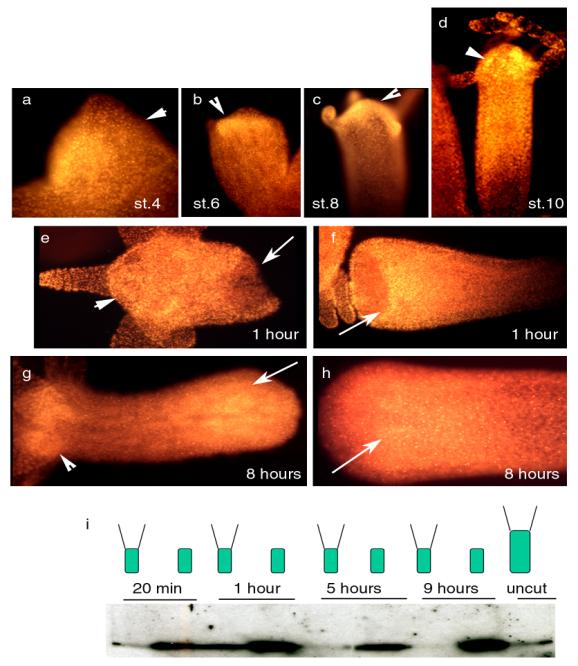
Figure 14: Whole-mount immunodetection of CREB showed the protein within the apical structures (arrowheads) of the bud at stages 4, 6, 8 and 10 (a-d). CREB protein up-regulation was noted in the stumps (arrows) of Hv regenerating animals during the 1st (e,f) and the 8th (g,h) hour after cutting. I) Western analysis detecting the CREB protein in Hv regenerating WCE.
decrease of CREB protein levels in the foot-regenerating stumps. One explanation might be the different affinity of the antihydra CREB antiserum towards the phosphorylated and the unphophorylated forms of the CREB protein in denatured conditions. In denatured conditions (Western analysis), the antihydra CREB antiserum might show a higher affinity for the phosphorylated than for the unphosphorylated form of CREB protein. Two additional arguments support this possible explanation: firstly, phosphatase treatment of WCE leads to a decrease in the CREB protein level detected in Western analysis (see Appendix I, Figure 1B, lanes 3-5). Secondly, in vitro kinase assays peformed with extracts prepared from regenerating animals showed a higher level of phosphoCREB protein during apical than basal regeneration (Appendix I, Figure 3). These results suggest that the CREB gene is regulated at the transcriptional / post-transcriptional levels immediately after amputation in a similar way in head- and foot-regnerating stumps. In contrast post-translational events like phosphorylation, might be dramatically different during apical regenerating where phosphoCREB level is maintained high, and basal regeneration where low levels of phosphoCREB were recorded. CREB Expression in the Chlorohydra viridissima multiheaded mutant The Cv multiheaded mutant (Cv mh) has the ability to generate multiple heads along its body axis, due to its deficiency to differentiate basal structures. During regeneration, heads and only heads will form at amputated sites. Thus in order to look at the potential correlation between the level of CREB gene expression and the ability to form apical structures, we decided to analyse the CREB expression in this mutant. In-situ hybridization experiments showed that CREB is expressed in apically-differentiated structures but also in regions along the body column that might be considered as presumptive head-forming regions (Figure 15a).

Figure 15: a) CREB transcripts were detected at the apical structures and in the "budding" regions of the adult polyp (arrow). b-d) CREB expression in regenerating stumps at the 4th, 8th and 36th hour of regeneration respectively.
In order to analyse CREB expression during regeneration process, every apical structure branching on the body column was excised at the level of the body column. One hour after excision, CREB expression was detected at every excised site (Figure 15b). After 8 hours, the CREB transcripts were found in both cell layers of the regenerating stumps (Figure 15c). At the 36th hour, the expression was restricted to the head-forming regions (Figure 15d). Thus the CREB expression patterns were found very similar in Hv and Cv mh: endodermal expression in the adult hypostome, immediate up-regulation after wounding, transient ectodermal expression at early stages of budding and regeneration. These observations strengthen the putative role of CREB in apical morphogenesis and maintenance of apical differentiation. III.1.3. Regeneration-specific CREB isoforms
As already reported, the vertebrate CREB gene undergoes several alternative splicing events that generate different isoforms (Figure 8) with distinct transcriptional activities. In Hydra, two different CREB isoforms, CREBa and CREBb, were isolated during the Hv cDNA library screening (Figure 7). In order to investigate the possible occurrence of a post-transcriptional regulation of CREB during Hydra morphogenetic processes, we performed comparative qualitative and quantitative RT-PCR analyses of the CREB transcripts during Hv and Ho regeneration, one hour after bisection, and in Cv wt and Cv mh intact animals (Figure 16 a-d). Compared to Hv, Ho animals are deficient for foot regeneration while Cv mh animals constitutively produce multiple heads along the body column when compared to Cv wt. This analysis that used the CREB-564 and CREB-downfish pair of primers (Figure 16 e,f), showed first that a third isoform, CREBd is formed very early during both head and foot regeneration in Hv (Figure 16a). The cloning and further analysis of this isoform showed that it was produced by an alternative splicing, that leads to premature termination upstream to the DNA-binding domain. Thus the CREBdisoform encodes a potentially non functional CREB that, in addition, lacks a myristilation motif present in CREBa and CREBb (ProSite search, http://www.expasy.ch/cgi-bin/nicedoc.pl?PDOC00008). Moreover, when another set of primers, CREB-downfish / CREB-iso, was used, two bands were obtained (Figure 16b). The CREB-iso primer is specific to the mini exon present in CREBa (Figure 16 e) that corresponds to the 400 bp band. Thus the 460 bp band indicates the presence of an additional exon (we named CREBd) that was not detected by the first set of primers. In Ho, the CREB-564 and CREB-downfish pair of primers detected three isoforms in intact animals (700, 540, 480 bp), two (540, 480 bp) in foot-regenerating halves and a unique major transcript (540 bp) in head-regenerating halves (Figure 16c). In Cv, two main transcripts (540, 480 bp) were detected, the second corresponding to the characterized CREBa isoform. In Cv wt the 540 bp transcript is predominant, while in Cv mh both the 540 and the 480 bp transcript are equally expressed (Figure 16d). This RT-PCR analysis used a pair of actin primers as control of template amount and was repeated in 2 independent experiments that provided similar results.

Figure 16: a-d) RT-PCR analysis performed on cDNAs prepared from different Hydra species, intact or one hour after mid-gastric section, and using either the downfish /564 (a-c) or the downfish /iso (d) pairs of primers. e) Deduced protein sequence of the different CREB isoforms. The position of the Hv primers is underlined and their names is writen in italic. Triangles indicate exon boundaries in Hv, inverted triangles indicate position of sequenced introns in Cv. f) Maps of the Cv, Hv-CREBa, Hv-CREBb, Hv-CREBd and Hv-CREBg isoforms that correspond to the RT-PCR depicted in a-c. Genomic DNA sequence is available only from Cv, the sequence of the Hv-CREBg isoform is not known yet. See DNA sequences in Appendix II.
These data show that the Hydra CREB gene is submitted to alternative splicing, possibly in correlation with morphogenetic processes. In fact at least one transcript, Hv CREBd is specifically produced immediately after amputation, while in regenerating Ho and in Cv mh, significant quantitative modulations are observed.
III.1.3. CREB Gene Expression and Light ExposureModulation in CREB isoforms during the light cycleIt was reported that the post-translational modification of CREB via phosphorylation is in some cases under the control of the light circadian rhythm (Ginty, 1993). In addition, the expression of one member of the CREB family, the ICER gene, which is produced by the use of an alternative promoter of the CREM gene, is under the control of a circadian light cycle (Foulkes, 1996). Thus several studies implicate light in the regulation of CREB family members at both transcriptional and post-translational levels.
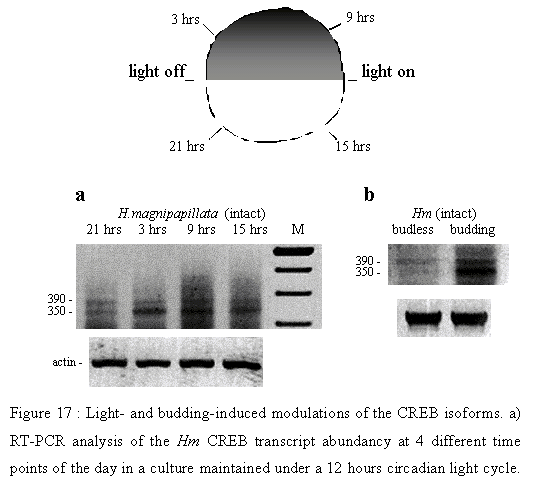
Figure 17: a) RT-PCR analysis of the Hm CREB transcript abundancy at 4 different time points of the day in a culture maintained under a 12 hours circadian light cycle. b) RT-PCR analysis of the Hm CREB transcript abundancy in budless and budding polyps.
Based on these observations, we analysed the regulation of CREB expression in a Hydra magnipapillata (Hm) culture that was maintained under a strict light circadian cycle for at least two months (Figure 17). Hm polyps taken at different time points to prepare mRNA and, after reverse transcription, we carried out PCRs that used the CREB-564 and CREB-downfish pair of primers. Two PCR products were obtained, about 350 bp and 390 bp long. The quantitative analysis of these PCR products indicated that the abundancy of the 350 bp isoform transcripts was significantly increased upon dark, three hours after switching off the lights and reaching its maximum level after nine hours. In contrast, the abundancy of this isoform was decreased by light exposure, already 3 hours after switching on the lights and reaching its minimal level after nine hours (Figure 17a). Finally, the 390 bp isoform transcripts showed steady low levels at all time points of this experiment. Thus these results provide some preliminary evidence for a possible regulation of the Hydra CREB gene at the transcriptional or posttranscriptional level by the circadian light cycle. In a complementary experiment, we compared 9 hours after switching on the lights, the relative abundancy of the Hm CREB isoforms in the budding and budless populations. We observed an overexpression of the 350 bp isoform in budding animals when compared to budless animals (Figure 17b). Therefore, the modulations in CREB splicing events observed under light/dark alternance might be related to variations in morphogenetic potentials. This 350 bp is not characterized yet but displays a size very close to that of the CREBd isoform that is up-regulaterd during Hv regeneration. Budding and regeneration rates are increased in the absence of lightIn order to investigate a possible variation of morphogenetic potentials with light/dark conditions, we cultivated in parallel two Hm populations that were kept either under a 24 hours light, or under permanent dark, except a three hours period of light every other day when animals were fed. By counting the animals every two weeks, we followed the reproductive rhythm of these populations for up to two months. This experiment was repeated twice (Table 4) and average values of the two experiments are depicted in Figure 18a.
After two months, the progression of the animal number was of 6.1x for animals kept in the dark conditions, and only 4.6x for animals kept in permanent light, corresponding thus to a 25% difference between the two populations. As we did no notice any substantial animal death, these numbers directly reflect the budding rate of the respective populations. Consequently, these data support the fact that the budding process is enhanced by the absence of light in Hydra.
As discusssed before, our data suggest a correlation between the light/dark cycle and the levels of the CREB-350 isoform transcripts in the adult polyps. In the dark conditions, CREB-350 isoform abundancy and budding rate are high whereas upon light exposure, the reverse is observed, CREB-350 isoform abundancy and budding rate are low. Therefore, we propose a possible regulatory pathway in Hydra that would link light exposure, CREB gene expression and budding rate.
As a complement, we investigated a possible influence of the light/dark exposure upon head regeneration. We established a culture from mechanically detached Hm adult buds that was maintained under 24hours light or dark exposure for two weeks and fed every other day . Then, animals were bisected at mid-gastric position, and left for regeneration either in total dark or under continuous light exposure. The appearance and number of tentacle buds were recorded on each stump 56 hours after amputation (Table 5). Hydra usually grows 2 tentacle buds (TB2) first, and then more tentacles will progressively appear on the head-regenerating stump. We have thus used that criteria to stage the regeneration process (TB3, TB4, TB5). This experiment was repeated twice independently and the average of these two values was plotted in a graph shown in Figure 18b. Among animals exposed to light, only 18.5% displayed 5 tentacle buds (TB5) at 56 hours while 41% of the dark-maintained animals had reached that stage at that time. As a consequence, the average number of tentacles per polyp is clearly decreased in the light-exposed population.
There is thus a significant delay in regeneration of apical structures in light-exposed animals when compared to dark-maintained ones. Thus in both contexts where we analysed the influence of light on developmental processes, i.e. budding and regeneration, the highest rates for head and/or axis formation were observed under dark conditions.

III.2. The Hydra Hedgehog (Hh) pathway
III.2.1. The Hh and Gli genes are present in Hydra
The Hydra Hh gene
In order to clone the Hydra Hh cognate gene, we used degenerated oligonucleotides located within the second exon of Hh genes (Kumar, 1996) to amplify a 180 bp fragment from Hv genomic DNA (the protein sequences corresponding to these primers was kindly provided by Juan-Carlos Ipsizua-Belmonte). The deduced protein sequence of this fragment (48 residues) was 87.5% identical to vertebrate Shh, 73% to the Drosophila cognate and 69% to the sea urchin Hh (Figure 19a). This surprisingly high level of conservation suggested that the selective constraint applied to this protein domain, is essential for Hh signaling (Hammerschmidt, 1997) and predates the divergence of cnidarians. Phylogenetic analyses of 28 sequences representing all phyla where a Hh gene could be isolated, showed that hydra Hh displayed an intermediate position between arthropod Hhs and the vertebrate Desert-type (Figure 19b). As Dhh may be the closest relative of an ancestral vertebrate Hh gene (Kumar, 1996), this position supports a view in which hydra Hh would represent an ancestral version of those forms found nowadays in living metazoans. The Southern analysis performed on Hv and artemia genomic DNA (Figure 19c), could show firstly that this Hh fragment was not cloned from artemia, the nutrient with which we daily feed our cultures, and secondly, that the Hh gene is most likely a single copy gene in the Hydra genome.
The Hydra Gli gene
After the cloning of Hh gene we tried to clone other members of the Hedgehog pathway. Thus, based on the phylogenetic conservation of the Gli/Ci transcription factor family, we designed a pair of primers (Gli-for2, Gli-rev2, see Appendix II) against the most conserved regions of the family. We isolated a 243 bp PCR product that was detected on Southern analysis by cross-hybridization with a mouse Gli probe and its deduced protein sequence (81 amino acids) showed a high level of conservation (Figure 20).
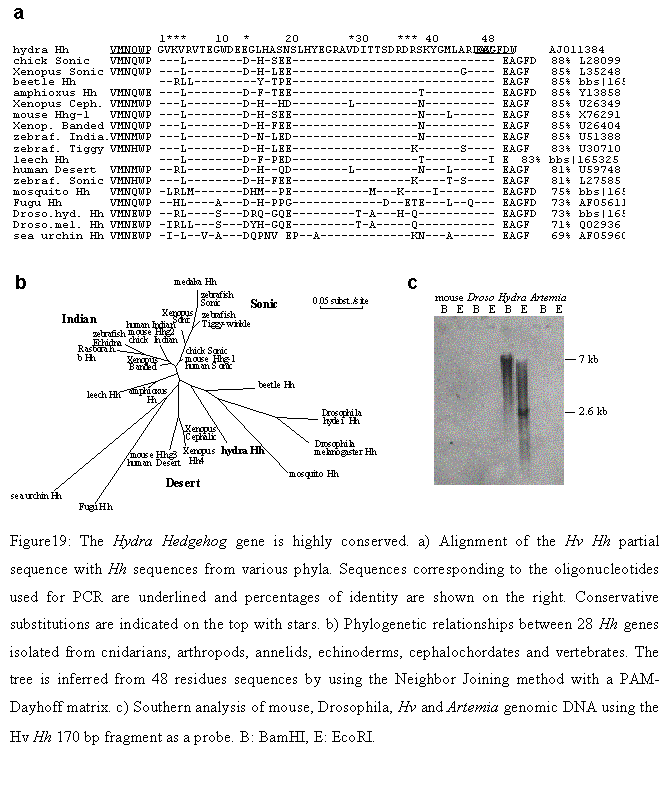
Figure 19: a) Alignment of the Hv Hh partial sequence with Hh sequences from various phyla. Sequences corresponding to the oligonucleotides used for PCR are underlined and percentages of identity are shown on the right. Conservative substitutions are indicated on the top with stars. b) Phylogenetic relationships between 28 Hh genes isolated from cnidarians, arthropods, annelids, echinoderms, cephalochordates and vertebrates. The tree is inferred from 48 residues sequences by using the Neighbor Joining method with a PAM-Dayhoff matrix. c) Southern analysis of mouse, Drosophila, Hv and Artemia genomic DNA using the Hv Hh 170 bp fragment as a probe. B: BamHI, E: EcoRI.

III.2.2. Hedgehog gene expression
We looked for a potential involvement of Hydra Hh in morphogenetic processes by mRNA in situ hybridization performed on whole mount specimen (Figure 21). In adult polyps, Hh expression was predominantly detected in endodermal cells of the hypostome and peduncle regions (Figure 21a,b), whereas absent from the mid-gastric segment, a region where undifferentiated cells are abundant and start to migrate towards the extremities of the animal meanwhile they gain their differentiated status. Therefore, Hh expression was not detected in the region where stem cells and precursor cells are predominant.

Figure 21: a,b) A budless adult polyp showing expression both apical and basal. This latter domain shows an upper border corresponding to the position of the future budding (see panels c and d). In b, head is viewed from the top. c, d) During budding, expression is maintained in the basal part of the parental polyp and appears distally in the bud; buds are stage 4, 3, 6 and 8 from left to right, respectively. e-l) Expression of Hh in the course of foot (e-h) and head (i-l) regeneration, at various time points following mid-gastric section. In panel f, the foot-regenerating hydra was dissected longitudinally to expose those endodermal positive cells (black arrowhead). In i-k, the head-regenerating stump is at the top. l: A transversal section of a 24 hrs head-regenerating stump is shown after JB-4 embedding, ect: ectoderm, end: endoderm. Bar: 0.8 mm.
Surprisingly, in budless as well as budding animals, a sharp boundary between expressing and non-expressing cells was consistently observed in the lower part of the parental polyp, immediately below the budding area (Figure 21a,c,d; arrow), at a level where no anatomical or cellular landmark is known to exist. This raised the possibility that the position of the bud would be fixed by the upper border of the Hh transcript domain (e.g. Figure 21d). This also indicated that the pre-budding Hydra already displayed a molecular regionalization, subsequently translated into differences in morphogenetic potentials. During budding, Hh was initially transcribed in endodermal cells of the future head region relatively late, at stage 4, about 16 hours before the tentacle rudiments emerged (Figure 21c,d).
We then looked at Hh expression in the course of regeneration following cutting of the animal. Soon after bisection, a symmetric expression domain was observed in ectodermal and endodermal cells of both upper and lower stumps (Figure 21e,f,i). However, maximal expression levels were scored in ectodermal cells of the head-regenerating stump after 24 hours, i.e. about 12 hours before tentacle buds became visible (Figure 21j,k,l). Such a robust Hh expression was nevertheless not observed in the foot-regenerating stump (Figure 21g,h), suggesting differential responses of Hh during head and foot formation. Altogether, these data point to a potential role for the Hydra Hh gene in pattern formation processes.
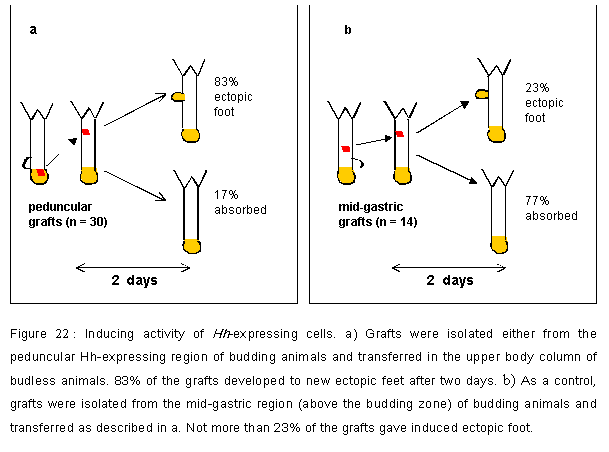
Figure 22: a) Grafts were isolated either from the peduncular Hh-expressing region of budding animals and transferred in the upper body column of budless animals. 83% of the grafts developed to new ectopic feet after two days. b) As a control, grafts were isolated from the mid-gastric region (above the budding zone) of budding animals and transferred as described in a. Not more than 23% of the grafts gave induced ectopic foot.
III.2.3. Functional analysis of the Hh expressing cells
Hh expressing cells induce ectopic foot formation and ectopic budding
The sharp boundary of the Hh expression observed just under the developing bud or under the budding-committed region led us design grafting experiments where we would transfer Hh expressing cells from the peduncular area into a more apical region along the body axis, hoping that these cells will continue expressing Hh. Would the ectopic Hh expression define a new budding zone, and as a consequence, could this graft induce an ectopic budding process ?
To approach these questions, we decided to elaborate the grafting experiments that are described in Figure 22. Thus we isolated and transfered a very small piece of tissue isolated either from the peduncular Hh expressing region or, as a negative control, from the region located above the budding zone that does not express Hh. For this purpose we used as donors stage 4-budding polyps and as hosts, non-budding animals in order to avoid any potential interactions between the graft and the bud of the host. For a similar reason, the region where the graft was placed onto the host was located within the apical half of the animal, again to avoid interactions with any budding process of the host. These grafts were monitored at two distinct levels, first at the phenotypic level (Table 2), second at the gene expression level (Table 3).

Figure 23: The fate of the grafts was studied by the labeling either the hosts (a,b) or the graft (c) with fluorescent beads. The non labeled graft is developing into a new basal structures after 48 hours with the participation of labeled cells migrating from the host towards the graft (b). When the graft was labeled some labeled cells migrating within the body column of the host were found 3 days after grafting (c). Within 3 to 4 days the graft developed into a complete ectopic basal structure (d, e). Around 10 days after grafting a budding process was eventually induced at the proximity of the ectopic foot (d,f). Three weeks postgrafting the induced bud had developed into an adult polyp ready to be detached (f).
At the phenotypic level, the outcome of these experiments, was a suprizingly high rate of a complete ectopic foot formation (83%) within the first 3 days after grafting peduncular grafts while in contrast mid-gastric grafts provided a high rate of resorption of the graft (77%, Figure 22). In addition, within 10 days after grafting, 4 out of 25 of the animals that had showed an ectopic foot, displayed a budding process facing the ectopic foot (Figure 23d,f and Table 2). In one case, a complete animal developped at that ectopic position, ready to detach after 3 weeks (Figure 23f). In case of the mid-gastric grafts, we never observed the formation of any ectopic budding process. These last observations provided strong evidence for a direct role played by the grafted tissue onto the host tissue for the establishment of a de novo budding zone and the subsequent initiation of a budding process.
In order to monitor the importance of the cell migration processes induced by grafting, we marked by injecting fluorescent beads into the gastric cavity (Technau, 1992) the endodermal cells of either the graft, or the host. After two or three days, we observed an important migration of cells from the host towards the graft, but a very limited one from the graft towards the host (Figure 23a-c). Thus, we expect that the inductive function played by the graft on the host tissue mostly results from extra-cellular signaling provided by the graft, possibly involving Hh to which host cells will respond.
Grafts containing Hh expressing cells induce ectopic Hh expression
In order to assess a possible role for Hh in this inductive process, we performed in-situ RNA hybridization with a Hh antisense riboprobe on the grafted animals (Figure 24). We observed a significant expression of the Hh gene in the graft 24 hours after grafting (Figure 24a-c), that does not depend on either the size (Figure 24c) or the position of the graft along the host body axis (Figure 24b). Ten days after grafting, Hh transcripts were also detected in the ectopic foot and the ectopic bud (Figure 24d,f). This ectopic Hh expression on the grafted host was localized in a well defined area limited by sharp boundaries and surrounded in some cases by multiple induced ectopic buds (Figure 24f). These observations raised substantial evidences for a participation of Hh in the induced ectopic budding.

Figure 24: a-c) Whole-mount in-situ detection of Hh transcripts on grafted Hv 24 hours after grafting. This ectopic expression is present whatever the proximity of the graft to the apical part of the host (b) or its size (c). d-f) Hh expression pattern in grafted polyps showing both an ectopic foot (ect.foot) and induced buds (ind. bud) 10 days after grafting. The Hh gene was still expressed in the ectopic basal structure (arrows) as well in the induced buds (arrowheads) and the peduncle of the host with a pattern similar to that observed in the non-grafted animal (e).
III.3. The hydra Iolaos gene
III.3.1. Iolaos encodes a Kazal-repeat protein
By pure serenpidity, we have isolated by using degenerated oligos designed against conserved regions of the Gli proteins (Gli-for1 and Gli-rev1, see Appendix II), a partial Hv cDNA (474 bp) that encodes 3 Kazal repeats (Figure 25).

Figure 25: Alignment of the Kazal-repeats found in the Hydra Iolaos protein with those present in the agrin (AGR), follistatin-related protein precursor (FRP), follistatin precursor (FSA), elastase inhibitor (IELA) acrosin-trypsin inhibitor (IAC), ovomucoid (IOVO), prostatic secretory glycoprotein (IPSG), pancreatic secretory trypsin inhibitor (IPST) proteins. This alignment was performed after BLAST analysis of the Hv Iolaos sequence and description of the Kazal motif at the Pfam site (PFOOO50) and Prosite (PS00282).
Kazal-repeats correspond to serine protease inhibitor domains, usually indicative of proteins acting as serine protease inhibitors. Kazal inhibitors belong to a family of proteins that includes pancreatic secretory trypsin inhibitor, avian, ovomucoid, acrosin inhibitor, and elastase inhibitor. These proteins contain between 1 and 7 Kazal-type inhibitor repeats whose structure includes a large quantity of extended chain, 2 short alpha-helices and a 3-stranded anti-parallel beta sheet. However, kazal-like domains are also seen in the extracellular part of agrins, follistatin precursors, which are not known to be protease inhibitors. By analogy with the other Kazal family members, the Iolaos protein is probably expressed extra-cellularly but its function cannot be predicted. A related elastase inhibitor was actually previously biochemically characterized from a sea anemona species, Anemona sulcata (IELA-ANESU in Figure 25) (Kolkenbrock, 1987 153; Tschesche, 1987 154).
III.3.2. Iolaos expression pattern
Whole mount in-situ hybridization performed with an antisense Ialaos riboprobe on total Hydra detected Ialaos transcripts in endodermal cells of the body column, extending from the upper part of the body column towards the upper limit of the budding zone (Figure 26b), excluding thus the head region in all animals analysed and the budding zone in about 50% of the animals. However when young budless animals just detached from the parent were analysed, most of them displayed an expression pattern extending into the peduncle and thus including the budding zone (Figure 26d). In contrast, no expression was noted in the budding zone of budding animals, where a sharp boundary in the upper limit of the budding zone was observed (Figure 26c). Finally, most animals displayed a weak expression domain in the basal region (the lower peduncle) of the body column. In a single animal that showed a differentiated oocyte, strong expression levels were scored in the oocyte area (Figure 26a). During budding, Ialaos is strongly expressed in endodermal cells of the developing bud at stages 4 to 6 (Figure 26b). Those observations indicated that Hv-Ialaos and Hv-Hh might play complementary roles to define the upper and the lower boundaries of the budding zone respectively. This function might anticipate that played by two components of the Wnt pathway, Tcf and b-catenin, that are transiently expressed within this zone at the time budding is initiated (Hobmayer, 2000).

Figure 26: Analysis of Iolaos expression pattern in budless polyps (a) show that transcripts progressively disappear from the budding zone (marked by bars), although some Iolaos expressing cells are located in the peduncle. In budding polyps (b), transcripts were not detected in the budding zone but present in the developing bud. c) In a unique polyp, we detected Iolaos transcripts in the oocyte (arrow).
IV. Discussion
IV.1. The CREB pathway in hydra
IV.1.1.CREB transcriptional and post-translational regulation in early morphogenetic events
The analysis of the CREB expression pattern showed at least three distinct specific modes of regulation. We observed a head-specific expression of CREB in the hypostome of adult polyps, an early temporo-spatial regulation of its expression during budding and regeneration, a late phase of expression at the time the head is forming. Thus, an appropriate regulation of the CREB gene is likely required i) for maintening head patterning in the adult polyps, ii) at the time early morphogenetic processes, i.e. either regeneration of head and foot, or budding are initiated, iii) when the head terminally differentiates.
During early regeneration, a first transient expression was observed at the wounding stage. Then two hours onwards after amputation, CREB transcripts were localized exclusively in the endodermal layer of the stumps The stump at that period of time was shown to be able to induce the formation of secundary heads on grafted animals (MacWilliams, 1983). Recently several genes similar to those implicated in organizer activity and/or positional information in bilaterians, have been cloned in Hydra. Among them, several encode putative regulatory proteins related to: the winged-helix gene budhead (Martinez, 1997), the Brachyury homolog HyBra (Technau, 1999), the Tcf and wnt genes (Hobmayer, 2000), and the nanos-related gene, Cnnos2 (Mochizuki, 2000), all of the these genes are expressed in endodermal cells of the adult hypostome and as early genes in endodermal cells of both, the regenerating stump as well the bud, but also during embryonic head formation in the case of HyBra1. Similarly, the aristaless-like prdl-a gene that is expressed in the nerve cell lineage in the adult ectodermal hypostome, shows a first early wave of transient expression in endodermal cells of the regenerating stump, before being detected in the overlying ectoderm at early --late stages (Gauchat, 1998). The Wnt pathway is fully conserved (at least at the molecular level) in Hydra (Hobmayer, 2000). Among the components of this pathway, Tcf and b-cat are turned on immediately after bisection while wnt transcripts are detected soon after in the regenerating stump. Thus all these genes, including CREB, are candidates for the establishment of the organizer activity detected decades ago by transplantation experiments: they are expressed in the regenerating stump at the time and at the place where morphogenetic activities were mapped. The endodermal cells that express most of these candidate components for the organizer activities, could possibly be considered as homologs to the endomesodermal cells responsible for organizer activity in bilaterians (Gauchat, 1998; Technau, 1999; Galliot, 2000).
Similarly, many of these genes are expressed during budding at early stages suggesting that common mechanisms are at work in the two contexts. However, initiation of budding might require specific molecular mechnisms (see below). For example, a transient belt of Tcf and b-catenin expression is detected in the adult body column, at the level where the bud will emerge, before any bud spot is detectable yet (Hobmayer, 2000). Thus this activation of the wnt pathway likely precedes the early "bud spot" expression observed with CREB. Later Tcf, wnt and CREB transcripts are found in the presumptive head of the developing bud, in a similar pattern to that observed during head regeneration.
IV.1.2. CREB regulation and the light cycle
In this study, we could show the influence of light on morphogenetic events, i.e. budding and regeneration rates are increased in the absence of light. In addition, we provide some preliminary evidences that suggest a light-dependent regulation of the CREB gene at the post-transcriptional level in Hydra. These data imply the potential existence of photoreceptors in Hydra. In fact, some cnidarians (cubozoans) do develop eyes, peripheral nervous structures that can sense and transmit light signals. Recently three cristallin genes were cloned from one of this jellyfish and shown to be regulated by the nuclear retinoid acid X receptor as it is the case in bilaterians (Kostrouch, 1998). To our knowledge, the characterization of Hydra photoreceptors was not reported yet but the reaction of Hydra to light was highly investigated at the behavioral and electro-physiological levels (Passano, 1962; Passano, 1964; Tardent, 1969).
The molecular mechanisms by which the light effect can be transduced and translated into the regulation of morphogenetic events in Hydra is a mystery. In mice, light-induced phase shifts in locomotor activity were consistently accompanied by CREB phosphorylation in the suprachiasmatic nucleus induced by pituitary adenylate cyclase- activating polypeptide (PACAP) and glutamate (von Gall, 1998). In Drosophila, the dCREB2 gene is likely involved in the circadian rhythm (Belvin, 1999). As we showed that the Hydra CREB is a target for kination events during regeneration (see Appendix I), we speculate that the light-induced effect could regulate similar kination events and subsequently the transcriptional activity of genes involved in morphogenetic mechanisms.
IV.2. The molecular steps of Hydra budding
The data provided by the expression analyses of the Tcf, b-catenin (Hobmayer, 2000), Hh, Iolaos (this work) genes on one hand and the CREB (this work) and prdl-a (Gauchat, 1998) genes on the other, imply that at least two distinctive and successive genetic programs are at work before an emerging bud can be observed macroscopically.
IV.2.1. The definition of the budding zone: the Hh and Iolaos boundaries
A dynamic process establishes the budding zone
The first genetic program will define a discrete zone along the body axis, the budding zone, where endodermal cells, but also probably ectodermal cells will become committed for the budding process. Several markers that map the budding zone, have been reported: the non-Hox Antp-class NK-2 gene (Grens, 1996) and the tyrosine kinase shin guard (Bridge, 2000) for the lower boundary, the Gsc expression domain (Broun, 1999) for the upper one. In this work, we have identified two new early markers for this budding zone in the adult polyp, the Hh and the Iolaos genes that are expressed below and above the budding zone respectively. In young budless polyps, these two boundaries are not established yet as evidenced by the extended domains of Hh and Iolaos expression that we observeds. We are curently performing some double-labelling in situ hybridization to confirm that in these animals, the Hh and Iolaos domains actually overlap in the future budding zone. We actually suspect that progressively as the animal age, these two domains of expression become restricted, basically in case of Hh, limited to a peduncle domain, apically in case of Iolaos, within a domain that finally covers about 60% of the body column. After restriction, two sharp boundaries are then observed that define the budding zone (Figure 27). Once established, the tissue contained within the budding zone is likely competent for budding as evidenced by the transient expression belts displayed by the Tcf and b -catenin transcripts, several hours before budding can be detected (Hobmayer, 2000).

Figure 27: In young budless animals, the Iolaos and Hh transcripts are detected in overlapping domains (left panel). After restriction, their respective lower and upper boundaries limit the budding zone where a transient expression of Tcf and b-catenin precedes bud formation (center panel). At earliest stages of budding, early genes are expressed in the bud area (right panel). Finally, CREB transcripts are always detected at the apical part of the polyp and the developing bud and sometimes within the peduncle (thus having an indication for CREB potential oscilation).
The Hedgehog boundary may act as an organizer region
We performed grafting experiments to uncover the potential role of the Hh-expressing tissue in the budding process. This approach indicated that a small area from the Hh expressing zone, was able to induce the formation of a new foot. In addition, this ectopic foot, likely by providing a new boundary in the body column between cells that express Hh and those that do not, was able to induce an ectopic complete budding process in several cases. Fluorescence labeling experiments indicated that this foot was able to recruit cells from the nearby tissue. Thus, these data suggest that the Hh-expressing region by providing this boundary acts as an organizer. The classic definition of an organizer is as following: An organizer is a cell population that is able to a) release inducers to the adjacent cells, b) guide the adjacent cells towards specific morphogenetic events, c) exchange cells with the adjacent tissues, d) differentiate itself into specific structures. This Hh-expressing region seems to satisfy all of the requirements of an organizer region.
Putative interactions between the Hh and the Wnt pathways in Hydra
The interactions between Wnt and Hh signaling pathways were first described in the ectodermal cells of the Drosophila abdominal segments and wing imaginal discs where boundaries form between the posterior compartment that express Hh and the anterior neighbouring cells where Hh acts indirectly by inducing Decapentaplegic or wg expression domains (Basler, 1994). Hh signaling regulates wg transcription through post-translational activation of Ci and the Gli/Ci binding sites present in the wg enhancer (Von Ohlen, 1997). Thus, in Drosophila the secreted signalling proteins Hedgehog, Wingless and Dpp provide the organizing activities required for axis formation (Strigini, 1999). The interactions between the Wnt and Hh signaling pathways, during development of vertebrates, were reported in many distinct developmental contexts, e.g. in the dorso-ventral patterning of the neural tube and patterning of the dermatomyotome (Lee, 2000), in the establishment of the antero-posterior (Shh) and dorso-ventral (Wnt-7a) axes of the limb (Capdevila, 1999), during tooth development where these interactions establish boundaries between oral and dental ectoderm (Sarkar, 2000). Thus, these interactions might reflect ancestral developmental mechanisms that could find some echo in Hydra patterning. The observed boundary in the budding zone between the Hh-expressing cells and the Tcf/ b -catenin expressing cells suggest a possible similar interaction that requires further analysis to be demonstrated.
IV.2.2. The definition of the bud spot
Once the budding zone defined, the position where the bud starts to emerge is marked by few molecular markers, like HyBra1 (Technau, 1999), wnt (Hobmayer, 2000) and CREB (this work). However, the mechanisms that permit a pool of adjacent cells that belong to the budding zone to develop as a bud, while cells located in its neighborhood will transiently become incompetent for budding, is not understood yet. Moreover, the first day of budding, there is a heavy recruitment of about 5000 epithelial and interstitial (mainly neural progenitors) cells towards the budding spot (Berking, 1980). The migration of parental cells towards the bud was recently monitored at the molecular level with the Otx gene that is expressed in those cells (Smith, 1999).
IV.2.3. The differentiation of a new axis
Early and early/late markers of apical formation
The tip of the evaginating bud expresses at early stages (stages 2 to 4) "early" markers that are also detected during early head regeneration. Examples such as: the winged-helix gene budhead (Martinez, 1997), the nPKC gene (Hassel, 1998), the Paired-class prdl-a homeobox gene (Gauchat, 1998), the brachyury homolog HyBra1 (Technau, 1999), the Antp-class cnox-1 homeobox gene (Gauchat, 2000), the Tcf and Wnt genes (Hobmayer, 2000), the nanosrelated-gene Cnnos 2 (Mochizuki, 2000) and the CREB gene (this work). Some molecular markers as the cPKC gene (Hassel, 1998), the goosecoid-related gene, Cngsc (Broun, 1999), the Antp-class cnox-2 homeobox gene (Gauchat, 2000) are expressed at later stages, prior tentacle buds formation. We name these latter markers "early/late" genes; their temporo-spatial regulation suggests that they are active not at the time head organizer is establishing but rather in the head differentiation process. The similarity on the temporo-spatial regulation of these two sets of genes suggest that head organizer activity on one hand and the head differentiation process on the other, rely on similar pathways during regeneration and budding. CREB shows distinct waves of expression at early and early/late stages in both budding and regeneration, and can therefore be considered as a putative head-organizer and head-differentiation gene. In contrast, Hh seems to be restricted to an early-late head-differentiation function during budding. In the bud itself, we did not detect Hh transcripts before stage 4. Similarly, during regeneration, we observed a weak expression at early times, but a high level of expression in ectodermal cells, of the head-regenerating stumps, beegining the second day after bisection. Thus the transient regulation of the Hh signaling pathway observed during apical differentiation at early/late stages of head regeneration (after 15 hours) and later stages of budding (from stage 5 onwards) is likely different from that described in the adult, either in the hypostome or the budding zone.
Putative interplay between CREB and other signalling pathways
Our expression analyses showed that in some contexts CREB and Hh transcripts were detected in the same tissues at the same time (hypostome, head regeneration, budding). Therefore, interactions between these two pathways during morphogenetic processes in Hydra are possible, even though this hypothesis would require a detailed spatial analysis of the Hh receptor cells. The characterization of Gli-expressing cells will provide soon a valuable information in that respect. However, the CREB-binding protein (CBP, not yet cloned in Hydra) might provide a link between these pathways in Hydra. CBP acts as a transcriptional co-activator that specifically binds the phosphorylated form of CREB (Chrivia, 1993) but is also working as a co-activator in several signalling pathways (Dai, 1996). In Drosophila, CBP is involved in the activation of Hh target genes, including wg in Drosophila, by interacting directly with the Ci (Gli homolog) transcription factor (Akimaru, 1997; Chen, 2000). In addition, the Drosophila CBP represses the Tcf transcription factor activity, antagonizing thus the wnt signalling pathway (Waltzer, 1998). Similarly, in vertebrates, two transcription factors involved in the early steps of the differentiation of the hematopoietic cell lineage, GATA-1 and c-Myb, bind to CBP in a competitive manner that probably provides the molecular basis for the mutual inhibition of their transcriptional activity (Takahashi, 2000). We have shown that a CREB regeneration-specific isoform (CREBd) is produced within the first hour after amputation. This isoform, as all the isoform characterized so far encode the KID domain but, as a unique feature, lacks the DNA-binding and dimerization domains. This truncated version of CREB is not functional as a transcription factor but is likely a target for activated kinases. One hypothesis would be that this phosphorylated CREBd then efficiently titrate the CBP activity present in the nuclei where it is expressed, and thus modulate the activity of CBP-dependent transcription factors, as CREB, Tcf, Gli. The expression and functional studies that will be performed in the coming years, should help decipher the interactions between these genetic networks and will probably reveal some tightly evolutionarily-controlled molecular networks required for basic animal morphogenetic events.