Introduction
Microscopic neuroanatomy (i.e., neurohistology) is the science bridging the gap between what can be analyzed grossly with the eye -the classical neuroanatomy- and the very subtle dynamic molecular analyses that can be performed on virtually every part of the human brain. The importance of anatomical microscopic studies should be emphasized in that they provide the first substrate to all analyses at the cellular or molecular level: the maps permitting not to be lost in these brain-shaped labyrinths.
Before being able to see the human body magnified, early anatomists around 450 BC considered the human brain as an empty shell where the phlegms took their source, the origin of all the emotions being located in the heart. Still, an anonymous hippocratic doctor wrote around 400 BC that «[...] it ought to be generally known that the source of our pleasure, merriment, laughter, amusement, as of our grief, pain, anxiety and tears, is none other that the brain. It is specifically the organ which enables to think, see and hear, and to distinguish the ugly and the beautiful, the bad and the good, pleasant and unpleasant. It is the brain too which is the seat of madness and delirium, of the fears and frights which assail us, often by night, but sometimes even by day; it is there where lies the cause of insomnia and sleep-walking, of thoughts that will not come, forgotten duties and eccentricities.» (Gross, 1998). Galen (199-130 BC) was the first to produce an accurate description of the anatomy of the brain. He discovered three liquid filled ventricles and hypothesized that they were the sites of storage of psychic pneuma (i.e., vital breath); on the other hand, he located the soul and higher cognitive functions in the solid portions of the brain. After a long middle-aged interruption of the anatomical studies, Leonardo da Vinci in the XVth century and Descartes in the XVIth century defended the hydraulic fluid theory of brain function, implying that the cerebrospinal fluid was pumped up through the ventricles producing limbs movements (Fig. 1). The turning point in the understanding of the brain structure and function came from the shortsighted XVIth century people, when the Janssen brothers developed a combined lens system to magnify objects, a concept that would have been perfectioned by Galileo a few years later.
 Fig. 1. Anatomical drawings of Leonardo da Vinci showing the cerebral ventricles working as a pump for limb movements (see text).
Since the fathers of the light microscope, Anthony Leeuwenhoek and Robert Hooke, first described in the XVIIth century the bacteria and cork tree cells using the single-lens and the more sophisticated compound microscopes, the histologic analyses took an ever important place in the understanding of the brain structures and function. Marcello Malpighi (1628-94) was the first one to suggest that the cerebral cortex was made up of «a mass of very minute glands» with attached fibers. The concept of cell itself, named «the cell theory», was conied first by T. Schwann and M.J. Schleiden in 1839 (Bracegirdle, 1993) enabling Theodor Meynert to perform histologic analyses of the cerebral cortex and to begin the description of its microscopic structure. Thereafter, the spectacular findings of the nitrate silver staining techniques by Golgi in 1873, the dahlia violet staining by Nissl in 1894 and the reduced nitrate silver staining by Ramón y Cajal in 1887 allowed the eye to dive in the details of the cells, thus opening the way to more sophisticated analyses about cell's shape, morphology and connections. Hence, Camillo Golgi edicted that the brain is composed by an autonomous and homogeneous diffuse nervous net composed of intermingled neurofibrils. This theory was counterfighted by Santiago Ramòn y Cajal who wrote the Neuron Theory in 1887, stipulating that the nervous cell has independent anatomical, genetic, functional, regenerative and reactive particularities thus establishing the foundations of the modern histology. Golgi and Ramòn y Cajal won the Nobel Prize in 1906 for their research on the structure of the nervous system.
The very first to describe the structure of a human brain in regard to its function and pathways were the earliest neuronatomists (Broca, 1863; Wernicke, 1874; Cunningham 1892) who analyzed the effect of the different localization of the brain lesions over the limbs motility and speech function. However, even if their observations and deductions were as precise as possible, the function and structure of the cerebral cortex was still terra incognita. As a human brain hemisphere is viewed from the side, it is surprising to see its folded surface due to the presence of gyri and sulci, which dramatically increases the surface of the human brain; this gyrencephaly allows a larger surface of cortex to be contained in the rigid skull. If the cerebral gyri were unfolded, their surface would be approximately 2,000 cm2 (Hubel and Wiesel, 1979). Some of these gyri and sulci are the gross landmarks of distinct cortical areas devoted to different quantitative and qualitative functions (Vogt, 1910; Sanides, 1962, 1972; Welker and Campos, 1963). These hemispheric gyri contain the cerebral cortex which is a laminated rind of neurons, sending projections to all parts of the central nervous system and comprising functionally different zones.
The human cortex can be further divided into neocortex (also called isocortex) and allocortex (Brodmann, 1909; Vogt, 1910). From an evolutionary anatomical standpoint, the allocortex appeared first during brain evolution, followed by the neocortex. The allocortex includes the rhinencephalon, which is mainly devoted to olfactory functions, and the limbic and hippocampal systems, which are involved in memory and emotional circuits. The neocortex contains primary areas, which receive projections from the sensory, motor and association areas.
Where allocortex follows rather a variable lamination pattern, going from one to as much as ten cellular layers (e.g., entorhinal area; Braak, 1972), the human neocortex is rather a six-layered structure characterized by regional and laminar specific distributions of a variety of neuronal subtypes and distinct afferent and efferent connections (Brodmann, 1904; Campbell, 1905; Ramón y Cajal, 1911; von Economo and Koskinas, 1925; Vogt and Vogt 1926). The neocortex can be parcellated into a large number of more or less distinct cortical fields according to microscopic architecture (e.g. Lewis and Clarke, 1878; Brodmann, 1904; Sanides, 1972). Brodmann (1909) defined as much as 52 functional areas distinguished by their different cellular organization and neuronal populations. (Fig. 2). Thus, several functional cortical areas such as primary motor cortex, premotor cortex, sensory cortex and visual cortex have been identified, each having their morphologic particularities.
The cortical layers are distinguished on the basis of the number, density, dendritic morphology, size and topographical distribution of particular cells. The six layers are subdivided as follow (Fig. 2) :
 Fig. 2. Brodmann's maps and areas.
One of the most prominent neuronal hallmarks of the cerebral cortex are the pyramidal cells, which are neurons that can be further classified according to their soma size and shape, ranging from the giant pyramidal cells of Betz in layer V to the minute and small pyramids in layers II, III and IV (von Economo and Koskinas, 1925; Meyer, 1987).
This study is focused on the microscopical characteristics of the layer V of the primary motor cortex, also called area 4 (Brodmann, 1904), and one of its pyramidal cells, the Betz cell. The morphology and topographical peculiarities of these cells will be analyzed in relation to the neighboring pyramidal neurons of layer V, to the functional anatomy of human brain, motoneuron diseases and evolution among species.
Microscopic identification of the primary motor cortex and its boundaries, however, has been particularly contentious. Brodmann (1903, 1909), based on the histological appearance of the cortical layers, originally described area 4 as an agranular zone, delineated by the presence of Betz cells, a subpopulation of giant infragranular pyramidal neurons in cortical layer V (Betz, 1874), located on its rostral border and buried in the depth of the anterior wall of the central sulcus. This definition has since been criticized (Zeki, 1979), and Brodmann's original delineation of the primary motor cortex has been revised by other investigators who described an intermediate precentral area (Campbell, 1905), an area precentralis A (Smith, 1907), an area FAg (von Economo and Koskinas, 1925), an area 42 (Vogt and Vogt, 1926, 1936), areas 4g (agranular, containing the Betz cells), 4a (agranular, devoid of Betz cells) and 4s (agranular, without Betz cells, but containing large cells in superior part of layer IV; von Bonin, 1949) and a frontal ganglionic core (Braak, 1980), all being to some extent part of the original description of Brodmann's area 4. More recent studies have shown that the primary motor cortex can be divided into two different subareas, 4a (anterior) and 4p (posterior), differing by their cytoarchitecture and distribution of various neurotransmitter binding sites (Geyer et al., 1996). While it is now widely accepted that the caudal boundary of the primary motor cortex is characterized by the appearance of a granular layer IV (in area 3a), an increasing cellular density in supragranular layers and a sharp division between white and grey matter, the rostral limit of the primary motor cortex remains more controversial (Bailey and von Bonin, 1951; Zilles, 1990; Geyer et al., 1996; White et al., 1997a,b). According to Brodmann's original definition of primary motor cortex, based on the presence of Betz cells, the absence of these cells anteriorly was considered a critical landmark for the boundary between area 4 and area 6.
The recognition of Betz cells in Nissl preparations is itself problematic, because they share most of their morphologic features with other large pyramidal neurons in layer V (Walshe, 1942; Kaiserman-Abramof and Peters, 1972; Braak and Braak, 1976; Wise 1985). Therefore, cell body size cannot be reliably taken as the sole discriminative feature of Betz cells. In fact, Betz cells differ from other pyramidal cells by their dendritic morphology. In most pyramidal cells, besides the apical shaft, dendritic arbors leave the cell body almost exclusively from basal angles and some of the largest cells have as many as six primary basal dendrites. Betz cells, however, have a higher number of primary dendritic shafts that leave the cell body asymmetrically at almost any point around the cell's basal circumference (Scheibel and Scheibel, 1978; Meyer, 1987) or from the cell body itself (Braak and Braak, 1976). The apical dendrites and soma of Betz cells are oriented along a vertical axis, wich may contribute to columnar processing in primary motor cortex (Meyer, 1987) Also, Betz cell somata are heterogeneous in shape including pyramidal, triangular, and spindle-shaped cell bodies (Braak and Braak, 1976).
Betz cells are found either solitarily or in small groups of three to four cells, especially in the dorsal part of area 4 (Brodmann, 1909; von Bonin, 1949). They have been reported to occur preferentially in the lower half of layer V thereby allowing for the distinction of two sublayers within layer V (layers Va and Vb; von Economo and Koskinas, 1925; Meyer 1987). The size of Betz cell bodies has been reported to decrease continuously along a mediolateral gradient (von Bonin, 1949; Zilles, 1990). This size reduction appears to be related to motor somatotopy: the largest cells are found in the region of foot and leg representation, where efferent axons project the farthest along the corticospinal tract. Early studies range in the values they report for the total number of Betz cells in one human hemisphere from 25,000 (Campbell, 1905), to 34,370 (Lassek, 1940; Lassek and Wheatley, 1945; Blinkov and Gelzer, 1968) and up to 40,000 (Scheibel and Scheibel, 1978). Lassek (1940) demonstrated that the numerical distribution of Betz cells is related to somatotopy, with 75% of all Betz cells in the leg area, 17.9% in the arm region and 6.6% in head area. However, his functional demarcation was not based on visible cytoarchitectural differences that could permit a precise delimitation of a functional motor zone.
No recent studies have assessed Betz cell number, volume and distribution in normal human brains. This is surprising in that being representative of a unique subpopulation of pyramidal cells, exclusively found in primary motor cortex, their morphology and distribution patterns should represent a topographical advantage or serve a particular function in comparison to other neighboring pyramidal cells of layer V. Furthermore, Betz cells are found in the motor cortex of all primates, thus assessing their functional peculiarity in the family of the great apes; a cellular element found systematically in a distinct category of individuals could be being considered as an evolutionary advantage.
The aim of this study is to asses Betz cells number, volume and distribution in the human primary motor cortex, in comparison to other layer V pyramidal neurons. On this purpose, we used modern stereologic techniques and Voronoi tessellation to obtain normative data about the cellular population of layer V of the human primary motor cortex and to correlate microscopic morphologic architecture with macroscopic anatomy and functional results obtained by fMRI (Yousry et al., 1997; Boroojerdi et al., 1999). Such data can be used further for comparative analyses of normal brain aging (e.g. Scheibel et al., 1977; Tigges, 1992) and neurodegenerative conditions affecting motoneurons such as amyotrophic lateral sclerosis (Hammer et al., 1979; Pamphlett et al., 1995; Gredal et al., 2000; Sasaki and Iwata, 1999).
1. Materials and methods
1.1. Tissue acquisition and preparation
All brains used in this study were obtained from 6 elderly individuals (5 women, 1 man; 75 to 96 years old) with no record of neurologic or psychiatric illnesses who had been hospitalized in the Department of Geriatrics, University of Geneva, Switzerland. The brain specimens were collected at autopsy within 12 hours of death and were fixed by immersion in 10% buffered formalin for up to 9 days. Only left hemispheres were used. The precentral gyrus, central sulcus, and postcentral gyrus (thus ensuring that the entire extent of area 4 was available) were dissected out and separated into 6 or 7 equally sized blocks, depending on the mediolateral length of the primary motor cortex for streologic analyses (Fig. 3) (Perl et al., 2000).
 Fig. 3. Localization of the primary motor cortex and dissection methods.
Area 4 is located in the depth of the central sulcus and on the anterior bank of the precentral gyrus (A). In each analyzed hemisphere, the central sulcus, precentral, and postcentral gyri (colored purple), were dissected out (B). Depending on the case, six to seven blocks were cut from the dissected cortical specimen (C). The blocks were prepared in equal size and their total number varied according to individual differences in the extent of the motor cortex. Blocks were kept in a strict medial to lateral orientation for sectioning and staining. In C block 1 is medial and block 7 is lateral, and the lateral face of each block is shown. Scale bar = 2 cm.
These tissue blocks were subsequently cryoprotected by immersion in graded sucrose solutions (up to 25%) and sectioned at 50 mm on a cryostat perpendicular to the axis of the central sulcus. All sections were kept in strict serial order. From each block a 1:20 series of sections was mounted on gelatin-coated slides, stained for Nissl substance with cresyl violet and coverslipped with Entellan.
1.2. Stereologic analyses
The volumes and numbers of Betz cells and neighboring pyramidal neurons were estimated using a computer-assisted image analysis system consisting of a Zeiss Axiophot 2 microscope equipped with a Zeiss MSP65 computer-controlled motorized stage, a Zeiss ZVS-47E video camera, a Macintosh G3 microcomputer, and NeuroZoom, a custom-designed morphometry and stereology software (Young et al., 1997; Nimchinsky et al., 2000).
One section per block was sampled in each case using a systematic-random design and cell numbers were estimated using the optical fractionator (West et al., 1991). Betz cells are located preferentially in the lower half of layer V of area 4 (von Economo and Koskinas, 1925), effectively subdividing the relatively thin layer V (about 0.7 mm in our materials, compared to the 0.8-0.9 mm of von Economo and Koskinas [1925]), into two sublayers. We outlined the boundaries of layer V of area 4 using cytoarchitectonic criteria based on Brodmann's descriptions of area 4 (e.g., White et al., 1997; Zilles et al., 2000). Some authors have recognized subdivisions of layer V in area 4 (von Economo and Koskinas, 1925; Meyer, 1987). Layer Va is characterized by a dense population of large pyramidal neurons that have a rather homogeneous apparent distribution (Fig. 4).
 Fig. 4 A et B. Laminar organization of the primary motor cortex (A).

Betz cells appear scattered throughout layer Vb, some of them forming clusters (B). These photomicrographs were taken from sections located in blocks 3 and 4, in the region of the «hand-knob». Layer boundaries are indicated in panel B. Scale bar (on B) = 200 mm (A) and 100 mm (B).
Layer Vb is conspicuous due to the presence of the giant Betz cells in addition to large pyramidal neurons. Betz cells are considerably larger than any other cell types in this layer. Also the apparent density of neurons is generally lower in layer Vb than in layer Va. Large pyramidal cells of any type are not present in layer VI permitting the definition of a clear boundary between layer V and VI (Fig. 4). We did not consider Betz cells the main discriminating feature of the primary motor cortex, but rather one among many criteria. After defining the boundaries of layer Vb on the computer graphic display of each section, the NeuroZoom software placed within each laminar boundary a set of optical disector frames (50 mm x 50 mm) in a systematic-random fashion corresponding to 3% of the sampled area for Betz cells or adjacent pyramidal cells. Neurons were then analyzed in each stack of optical disectors (each disector was 5 mm in depth if a neuron corresponding cytomorphologically to a Betz cell was encoutered [see below for criteria], and 2 mm for other pyramidal cells), according to stereologic principles. The thickness of these disector stacks, termed «multisectors» in the NeuroZoom software (Nimchinsky et al., 2000), was kept constant within each case and depended on the measured thickness of the sampled sections, which varied between 15 and 20 mm among cases. The shrinkage resulting from histological processing did not influence the estimates of total neuronal numbers as the optical fractionator does not depend on a calculation of the total volume of the region. Sampling of Betz cells and surrounding pyramidal cells was thus accomplished through the entirety of the sections' thickness less a 2 mm guard zone on either side of the sections. Interneurons were not included in the analysis. For the rotator analysis, which was combined with the optical fractionator (Fig. 5A), the vertical axis of the probe was a line running strictly superior-to-inferior with respect to the pial surface as it was not possible to perform isotropic-uniform-random sections in the available materials. However, coronal sections and isotropic-uniform-random sections have been shown to yield comparable results (Schmitz et al., 1999), and due to the orientation of the tissue in our preparations, not all neurons were necessarily cut along the same axis thereby allowing for a certain degree of randomness in the sample. Only neurons whose nucleus was enclosed within the counting frame or in contact with its permitted edges were analyzed, and the nucleolus was consistently chosen as a reference landmark for the focal plane during fractionator and rotator analysis. During data acquisition, Betz cells were tentatively identified by a conspicuous nucleolus, a prominent rough endoplasmic reticulum, large lipofuscin deposits in the cell body and a dendritic arbor leaving from the entire circumference of the soma (Scheibel et al., 1977; Braak and Braak, 1979; Zilles, 1990). All analyses were performed using a 1.4 N.A. 40x Plan-NeoFluar Zeiss objective with a 1.4 N.A. auxiliary condenser lens and Koehler illumination to achieve optimal optical sectioning.
Statistical comparisons were made between blocks in order to determine if differences in neuron number or cellular volume existed between different mediolateral locations along area 4 using a one-way ANOVA and post-hoc t tests. Blocks were numbered from 1 (most medial) to 6 or 7 (most lateral). Coefficients of error and coefficients of variation were also calculated (Schmitz, 1998; Schmitz and Hof, 2000). Overall, 4,931 cells were sampled using this scheme. To assess the distribution of cellular volumes, we calculated the percentage of cells (without distinguishing between Betz and pyramidal cells) within volume bins for each case. The cumulative frequency of each volume bin was also calculated. Statistical differences between volume distributions based on these cumulative frequencies were assessed using the Kolmogorov-Smirnov test.
1.3. Analysis of Betz cell distribution
Betz cells from the same systematic-randomly sampled sections used for stereological analysis were mapped along the primary motor cortex using NeuroLucida software (MicroBrightfield Inc., Colchester, VT). The boundaries of layer Vb of the primary motor cortex were drawn using 5x or 10x Fluar Zeiss objectives and markers were placed on all visible Betz cells. These maps were then converted to polygon maps using Voronoi tessellation. With the VORON software (Duyckaerts and Godefroy, 2000), Voronoi tessellations permit to estimate in two dimensions the degree to which particles are clustered, randomly distributed, or have a regular arrangements. It tests only the distribution of particles, but does not address their numbers or densities, in the entire region analyzed. This approach is based on a principle by which polygons are drawn around mapped points, Betz cells in this case, according to a simple algorithm that bisects each tangent connecting a particle to each of its closest neighbors. The resulting polygons area is inversely proportional to the local cell packing density (Duyckaerts and Godefroy, 2000). A density mosaic is formed by these polygons, with the smallest polygons occurring where cells have a clustered distribution (Fig. 5B, C).
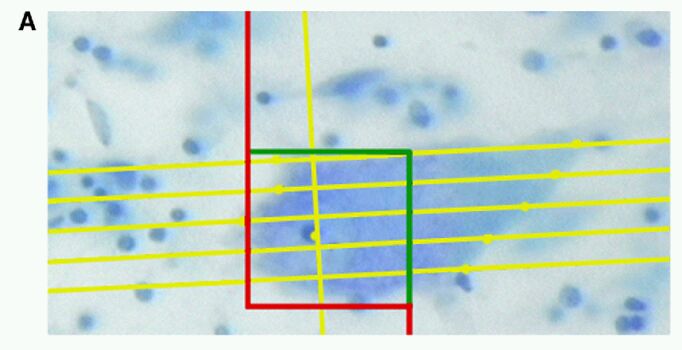 Fig. 5 A, B et C. Quantification of neuronal number and volume with the NeuroZoom software


Quantification of neuronal number and volume with the NeuroZoom software (A). A disector counting frame of 50 mm x 50 mm was used. Five rotator test lines can be seen crossing the Betz cell soma, with dots pointing to their intersections with the soma border. For analysis of Betz cell distribution, we generated high magnification Voronoi tessellation maps (B). A view of the corresponding microscopic field is shown on C. Betz cells are represented by yellow dots and the size of the polygon drawn around them is inversely proportional to their individual packing density. The smallest polygons, color-coded in red, are zones where clustering occurs. Scale bar (for B and C) = 100 mm.
The general coefficient of variation, local coefficient of variation, and coefficient of clustering were calculated. The general coefficient of variation (GCV) was calculated on the basis of all the polygon areas. The local coefficient of variation (LCV) is the mean of the coefficient of variations of all of the individual polygons and their immediate neighbors. The coefficient of clustering represents the ratio GCV/LCV and reflects cells distribution. If the cells are randomly distributed, the LCV will tend to be equal to the GCV and the coefficient of clustering will be close to 1. In contrast, if the ratio GCV/LCV is high, cells represented by marked points are clustered (Duyckaerts and Godefroy, 2000). For each case the block where Betz cells were maximally clustered (i.e., where the coefficient of clustering was maximal) was identified. The total number of Betz cells in this block was estimated as a fraction of the total for the whole area 4 as determined by the optical fractionator. Analysis of variance (ANOVA) and post-hoc pair-wise t tests with Sidak and Bonferroni correction were used to assess differences in coefficient of clustering among blocks in all of the cases.
To illustrate the distribution of cell volumes and clusters on the surface of a brain hemisphere, the amount of tissue lost between blocks during the initial sampling was considered for each case (less than 1 mm was lost per block) and an individual correction factor was calculated to estimate the actual length of the primary motor cortex. Regional maxima in cellular volume and clustering were then reported onto a digital image of the brain surface using Adobe Photoshop software. All photomicrographs were obtained using a Nikon CoolPix 990 digital camera mounted on a Zeiss Axiophot 2 photomicroscope, processed using Adobe Photoshop 5.5, and printed on a high resolution Fujix Pictography 3000 color printer. Only minor adjustements of contrast and brightness were performed which in no case altered the appearance of the original materials.
2. Results
2.1. Histologic criteria
To analyze adequately Betz cell number and volume in layer Vb of the primary motor cortex (Fig. 4), a reliable set of criteria had to be defined to identify them. Based on previous histological descriptions of Betz cells (Campbell, 1905; Brodmann, 1909; Welche, 1942; Scheibel and Scheibel, 1978; Braak and Braak, 1979), we considered large pyramidal neurons displaying a conspicuous nucleolus, a prominent rough endoplasmic reticulum, large lipofuscin deposits in the cell body and dendritic branches leaving from the entire circumference of the soma to be Betz cells (Figs 6A, 7). In contrast, adjacent non-Betz pyramidal cells were recognized precisely by the lack of these characteristic morphological features (Fig. 6B). Betz cells themselves were variable in shape. Betz cells which were located deeper in the central sulcus next to the boundary with area 3a were more triangular or rounder than the ones located near the anterior boundary of primary motor cortex, which had a fusiform shape (Fig. 7).
 Fig. 6 A et B. High magnification photomicrographs comparing the histologic characteristics of a Betz cell (A) to neighboring pyramidal cells (B)

High magnification photomicrographs comparing the histologic characteristics of a Betz cell (A) to neighboring pyramidal cells (B). Note the larger size, conspicuous nucleolus, abundant rough endoplasmic reticulum, perisomatic dendrites (in addition to the basal dendrites; arrowheads), and lipofuscin accumulation (arrow). These were the cytomorphologic criteria used to identify Betz cells during the analysis. Scale bar = 80 mm.
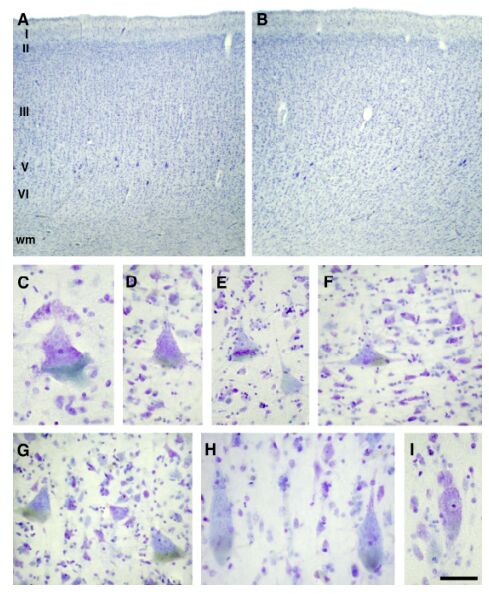 Fig. 7. Depending on their location in the primary motor cortex, Betz cells exhibited morphological variability.
Depending on their location in the primary motor cortex, Betz cells exhibited morphological variability. Toward the depth of the central sulcus (A), and in the vicinity of the border of area 3a, rounder or squatter Betz cells were observed (C-F). In the «hand-knob» region they were nearly triangular (G), whereas at the rostral boundary of the primary motor cortex near the border to area 6 (B), Betz cells adopted a more fusiform shape (H, I). Scale bar (on I) = 300 mm (A, B) and 50 mm (C-I).
Cytoarchitectural criteria were used to outline the boundaries of the primary motor cortex. The posterior limit of the primary motor cortex (between Brodmann's areas 3a and 4) was more difficult to establish with precision and in this study was placed where layer IV, which is well visible in area 3a, disappeared and where the limit between the white and gray matter became blurred (White et al., 1997b). The anterior boundary of the primary motor cortex (between Brodmann's areas 4 and 6) was placed in the middle of a transitional zone where large pyramidal neurons begin to appear in layer III.
2.2. Stereologic assessment of cell numbers and volumes
The total number of Betz and pyramidal cells in layer Vb of the left primary motor cortex was estimated using the optical fractionator (Table 1). The number of Betz cells ranged among the six cases from 96,220 to 165,920 cells, with a mean of 125,290 cells. In comparison, the average number of non-Betz pyramidal cells in layer Vb was 1,026,630 cells, with a range of 471,240 to 1,673,740 cells. The total number of pyramidal neurons in layer Vb was on average 1,151,920 cells, with values ranging from 567,460 to 1,973,700 cells. The percentage of Betz cells in comparison to the total number of pyramidal neurons was determined: on average, the Betz cell population represents 12.2% (range: 5.1 to 17%; Table 1) of the pyramidal neurons in layer Vb. The great amount of variability in the numbers of pyramidal neuron subtypes in layer V could not be explained by sex or age differences.
The volumes of Betz cells were estimated with the rotator (Fig. 4A; Table 1). The mean Betz cell volume was 86,685 mm3 (range among the 6 cases: 66,010 to 113,146 mm3). The average non-Betz pyramidal cell volume was 4,274 mm3 (range for all cases: 3,606 to 4,826 mm3). The overall mean volume of all pyramidal neurons in layer Vb was 90,959 mm3, ranging from 70,835 to 117,417 mm3 depending on the case. To compare the cellular volumes of Betz cells and pyramidal neurons, we calculated the ratio of the volumes of Betz cells to pyramidal cells (Table 1). Betz cells volumes were larger than the volumes of pyramidal cells by a factor of 20.4 (p < 0.001), supporting a clear distinction between these cellular populations based on somatic volume.
| Table 1. Betz cell and pyramidal cell numbers and volumes. |
| Neuronal numbers |
|
|
|
|
|
|
| Cases |
Betz cells |
CE |
Pyramidal cells |
CE |
Total |
CE |
Betz % |
| A |
134,300 |
0.05 |
1,189,320 |
0.10 |
1,323,620 |
0.04 |
10.1 |
| B |
144,840 |
0.05 |
953,700 |
0.11 |
1,098,540 |
0.04 |
13.2 |
| C |
96,220 |
0.06 |
471,240 |
0.15 |
567,460 |
0.06 |
17.0 |
| D |
110,500 |
0.06 |
729,300 |
0.12 |
839,800 |
0.05 |
13.2 |
| E |
99,960 |
0.06 |
1,873,740 |
0.13 |
1,973,700 |
0.05 |
5.1 |
| F |
165,920 |
0.05 |
942,480 |
0.11 |
1,108,400 |
0.04 |
15.0 |
| Means |
125,290.0 |
|
1,026,630.0 |
|
1,151,920.0 |
|
12.2 |
| SD |
27,639.1 |
|
480,276.3 |
|
479,282.6 |
|
4.2 |
| CV |
0.22 |
|
0.47 |
|
0.42 |
|
|
| |
| Neuronal volumes |
|
|
| Cases |
Betz cells |
Pyramidal cells |
Betz/Pyramidal cells |
| A |
110,146.0 |
4,514.1 |
24.4 |
| B |
79,112.2 |
3,936.2 |
20.1 |
| C |
72,845.5 |
3,606.1 |
20.2 |
| D |
66,009. 6 |
4,826.1 |
13.7 |
| E |
113,125.2 |
4,292.1 |
26.4 |
| F |
78,876.7 |
4,468.9 |
17.7 |
| Means |
86,685.9 |
4,274.0 |
20.4 |
| SD |
19,934.0 |
438.3 |
4.6 |
| CV |
0.23 |
0.10 |
0.23 |
The raw data from the stereologic analysis of each case are shown, as well as the means, standard deviations (SD), coefficients of variation (CV), and coefficients of error (CE). The Betz percentage represents the proportion of Betz cells from the total number of layer Vb pyramidal neurons in the primary motor cortex (top). The ratio of Betz cell volume to pyramidal cell volume was calculated to compare the cellular volumes of these two distinct populations of neurons (bottom).
We expressed all cellular volumes (without categorical distinction) as a percentage of the total volume range. The distribution of the cellular volumes was clearly bimodal, with one peak between 3,000 and 4,000 mm3, and another peak between 50,000 to 100,000 mm3 (p < 0.001). A distinct volumetric cut-off was identified that differentiates pyramidal cells from Betz cells at 20,000 mm3 (Fig. 8A). To estimate the small amount of overlap that might exist between these two cellular populations, we searched for the largest volume of a cell that we considered to be a non-Betz pyramidal cell, (18,501 mm3), and the smallest volume of a cell that we considered to be a Betz cell, (10,905 mm3; the next smallest value for Betz cells was 20,513 mm3), according to our histologic criteria. We then calculated the percentage of cellular volumes found between 15,000 and 30,000 mm3, without distinguishing between Betz cells and pyramidal non-Betz cells. We observed that 3.8% of all cellular volumes occupied this range. Making a categorical distinction (according to our criteria) between Betz and pyramidal cells, we found that 2.9% of pyramidal cells and 5.7% of Betz cells, respectively, fell within the range of 10,000 and 30,000 mm3. These data show that there is minimal overlap between the volumes of these two different cell subtypes and that the volumetric range of overlap is limited. To further characterize the distribution of the volumes of the two cell populations, we plotted the cumulative percentage of the volumes against the cell volumes. The resulting curves show that the cellular volumes increase sharply and in a parallel fashion at the two extremes of the volume ranges, confirming the presence of two distinct cellular types, which can be distinguished by their volumes based on these quantitative data (p < 0.001; Fig. 8B).
 Fig. 8 A et B. Betz cell and layer Vb pyramidal cell volume distributions.

Betz cell and layer Vb pyramidal cell volume distributions. Histograms of cell volumes expressed as the total number of cells observed within volume bins (A), and as a percent and cumulative frequency of the distribution of volumes by subtype (B). Pyramidal cell volumes appear on the left and Betz cell volumes on the right. The volume distribution is strongly bimodal (A) with maximal pyramidal cell volumes ranging between 3,000 and 4,000 mm3 and maximal Betz cell volumes ranging between 50,000 and 100,000 mm3. The cut-off point to distinguish Betz cell from pyramidal cell volume appears clearly around 20,000 mm3. The cumulative frequency clearly shows the difference between the two populations (B). Note that, since Betz cells volumes are distributed over a much greater range than pyramidal cells, the x-axis scales differ for Betz and pyramidal cells.
For each case, Betz and pyramidal cell volume differences were analyzed according to block number, thus reflecting their mediolateral location (Fig. 9A). For all six cases, the Betz cell volumes decreased from block number 1 (medial) to block number 6 (lateral). We calculated the average volume per block across all of the cases (Fig. 10A) and block number 2 consistently contained Betz cells with the largest volumes (p < 0.05). This confirms the observation of von Bonin (1949) that Betz cell volume follows a mediolateral gradient along the primary motor cortex. Non-Betz pyramidal cell volumes expressed per case and as a mean per block were homogeneous throughout the primary motor cortex (Figs. 9B, 10B). The fact that the largest Betz cells were located in the medial portion of the primary motor cortex (Figs. 10A, 11H), corroborates the observation that the size of the Betz cells is larger in the areas representing the foot and leg (Lassek, 1940; Zilles, 1990).
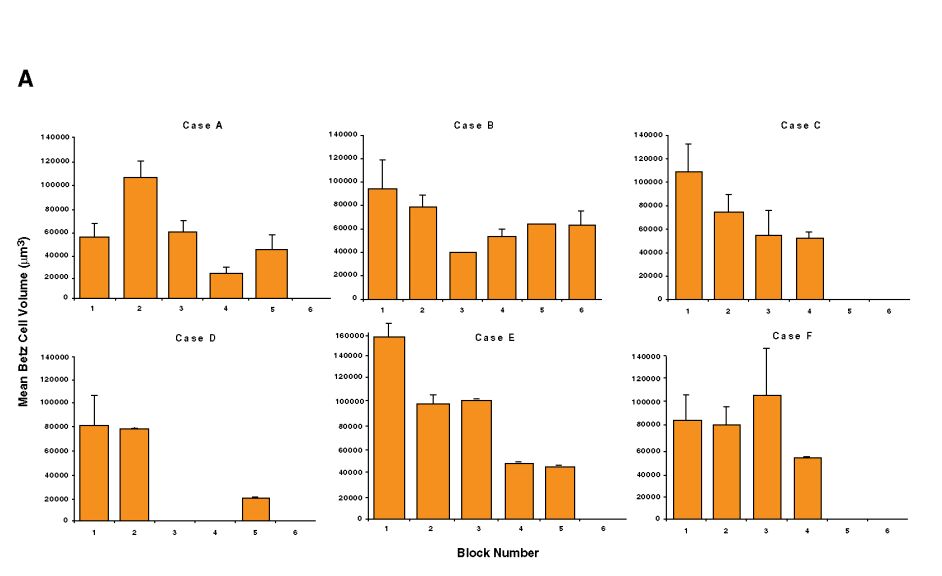 Fig. 9 A et B. Betz cell and pyramidal cell volumes expressed as a mean in each block, for each case separately.

Betz cell and pyramidal cell volumes expressed as a mean in each block, for each case separately. Betz cell volumes are more variable along area 4 (A), in contrast to pyramidal cell volumes, which remain relatively comparable throughout the whole region (B). Missing values in panel A mean that no volume data were available from these blocks. Generally, Betz cells were very rarely observed in block 7.
 Fig. 10 A et B. Betz cell and pyramidal cell volumes expressed as a mean per block across all of the cases.
Betz cell and pyramidal cell volumes expressed as a mean per block across all of the cases Betz cell volumes (A) are higher in block number 2 compared to the other blocks (p < 0.05). Pyramidal cell volumes (B) do not differ significantly among blocks.
2.3. Tessellation maps and coefficient of clustering
The distribution of local Betz cell densities was assessed using Voronoi tessellation (Duyckaerts and Godefroy, 2000). The resulting distribution patterns were similar in all cases, showing high Betz cell clustering in the medial part of the primary motor cortex, and a progressive decrease in density toward the Sylvian fissure (Fig. 11A-G). To confirm this, we analyzed the coefficient of clustering of Betz cells in each case (Fig. 12A). In 5 of the 6 cases this coefficient was maximal for block number 3 or number 4. In one case (case E), the maximum of the coefficient of clustering was located in block number 2. However, when all of the cases were analyzed together with ANOVA, the coefficient of clustering in block 4 was significantly greater than that in other blocks (p < 0.05; Fig. 12B). Due to interindividual variability in motor cortex length, the number of blocks was not equal in all of the cases, possibly biasing the results when expressed per block number. Tessellation maps and coefficient of clustering statistics of Betz cells were produced from all of the slides from one reference case (case F). The results were comparable to the analysis performed in the other cases where only one slide per block was analyzed, with a maximal coefficient of clustering located approximately at two-thirds of the length of the primary motor cortex laterally from the interhemispheric fissure. To illustrate the localization of this area of maximal Betz cell clustering, we estimated its position on the cortical surface of each case separately. This area is located roughly at the junction of the superior and medial frontal gyri with the precentral gyrus (summarized in Fig. 13), corresponding generally to the previously described «hand-knob» region (Yousry et al., 1997; Boroojerdi et al., 1999; Takahashi et al., 2002). Other pyramidal cells showed a uniform spatial distribution pattern throughout the entire primary motor cortex.
 Fig. 11. Voronoi tessellation maps of layer Vb showing the analysis of the cellular density and clustering of Betz cells in case F (A-G).
Voronoi tessellation maps of layer Vb showing the analysis of the cellular density and clustering of Betz cells in case F (A-G). This example runs from block 1 (medial, A) to block 7 (lateral, G). On the color-coded maps, the smallest polygons (i.e., the regions of highest packing density) appear in red, while blue corresponds to the largest polygons (i.e., the regions with low packing density). The uncolored maps show the polygons drawn around the Betz cells, which are represented as red dots. In this analysis, the Betz cells appear to form clusters along the whole extent of layer Vb of area 4, as represented by the red polygons with a maximal degree of clustering in blocks 3 to 5. All maps are shown to scale and are oriented in the same manner (G; the length of dorsal-ventral [D-V] or anterior-posterior [A-P] directions of the orientation key is approximately 5 mm and applies to A-G).
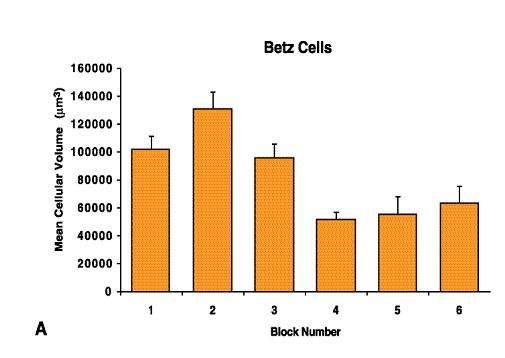 Fig. 12 A. Betz Cells
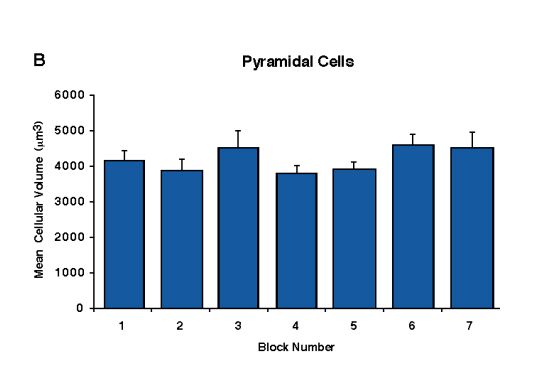
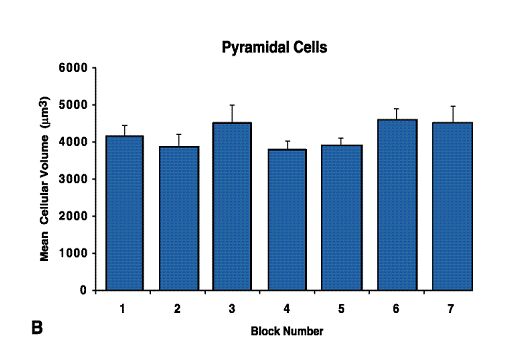 Fig.12 B. Pyramidal Cells
The coefficient of clustering of Betz cells in case F (A) reveals that the maximal clustering zone corresponds to block 4 (see also Fig. 9H). The mean coefficient of clustering of Betz cells across all of the cases was calculated from individual measures (B) and the values of mean clustering per block reveal that the zone of maximal Betz cell clustering is generally located in block number 4 (p < 0.05).
 Fig 13. The topographic distribution of Betz cells maximal volume and clustering on the primary motor cortex is shown on the same hemisphere as in Figure 3 (left) with the dissected zone highlighted in purple.
The topographic distribution of Betz cells maximal volume and clustering on the primary motor cortex is shown on the same hemisphere as in Figure 3 (left) with the dissected zone highlighted in purple. The zone with the largest Betz cells corresponding to the leg and foot representation appears in light blue. The zone of maximal Betz cell clustering across all of the cases is shown in dark purple and is also mapped onto a sulcal view of area 4 (right). The localization of the tissue block with the maximal coefficient of clustering block in this case is shown (arrowheads and bars). Scale bar = 2 cm.
3. Discussion
3.1. Overview of Quantitative Findings
The present study demonstrates that the Betz cells of human primary motor cortex represent a heterogeneous neuronal population in terms of size, shape, volume, and distribution. The use of a rigorous stereological approach to estimate volumes and total numbers of all pyramidal neurons in layer Vb also revealed notable differences in comparison to results from earlier studies of Betz cells (Campbell, 1905; Lassek, 1939). This study demonstrates that Betz cells have different distribution patterns within the human primary motor cortex in terms of their shape, volume and clustering.
The observed differences in Betz cell shape in the anterior and posterior part of the primary motor cortex may be related to two distinct subareas in primary motor cortex (Geyer et al., 1996). The distribution of the volumes of Betz and other pyramidal cells follows a bimodal distribution with two maxima, delineating two different neuronal populations with a clear cut-off at values around 20,000 mm3 (the overlap of these two separate populations representing approximately 3.8% of the total of the volumes analyzed). Moreover, Betz cell volumes follow a mediolateral gradient along area 4, as first suggested by Brodmann (1909) and von Bonin (1949), which is likely to be correlated with the functional motor representation of the hind limb. In contrast, the volume of other pyramidal cells in layer Vb is homogeneous, not differing along the mediolateral axis of the region. Analyses of spatial distribution indicated that Betz cells are organized as a specialized group of neurons forming clusters in layer V and that their distribution along the human primary motor cortex is not homogeneous. Using Voronoi tessellations we demonstrated that Betz cells form clusters with a maximal clustering zone situated midway between the interhemispheric and Sylvian fissures (25,380 mm on average) in the region of the «hand-knob». Interestingly, if we consider the total number of Betz cells in the block showing their densest clustering, we found that on average 6,800 of them occur at this location (about 5.5% of all Betz cells), which is likely to correlate with the functional motor representation of the hand. This variability in Betz cell shape and distribution may provide new clues to explore further the relationships between functional anatomical zone and cytomorphologic characteristics of the primary motor cortex.
3.2. Boundaries of Human Primary Motor Cortex
In contrast to Brodmann's early descriptions, it has been widely recognized that the gross morphology of the cortical sulci and gyri does not correspond precisely to distinct functional areas (Rademacher et al., 1993; Geyer et al., 1996; White et al., 1997a,b; Rademacher et al., 2001), even if some evidence exist that certain sulci demarcate specific cortical areas (Vogt, 1910; Sanides, 1962, 1972; Welker and Campos, 1963; Zilles, 1990). Thus, the precentral gyrus and the depth of the anterior bank of the central sulcus cannot be used as reliable topographical criteria to precisely localize the primary motor cortex. It is generally accepted that Brodmann's area 4 represents the human primary motor cortex, or at least a major part of it. Brodmann's interpretation of area 4 representing the human primary motor cortex (Brodmann, 1903, 1905, 1906, 1909) has led to misinterpretations, in part because of his schematic drawings that do not provide information about interindividual variability in the shape and cytoarchitecture of the brain (Filimonoff, 1932; Rademacher, 1993; Geyer et al., 1996, 1999; Zilles et al., 1997; Schleicher et al., 2000; Amunts et al., 2000). Misinterpretations also arose because of area 4's extension onto the convexity of the precentral gyrus. A recent study showed that area 4 itself includes two distinct zones: areas 4a (anterior) and 4p (posterior) that differ quantitatively in cellular density and distribution of neurotransmitter binding sites, and exhibit separate functional patterns depending on the roughness or the subtlety of the movements of the hand and digits, as demonstrated by positron emission tomography analyses (Geyer et al., 1996). This separation of the primary motor cortex into an anterior and posterior zone based on cytomorphological and biochemical differences could be related to our result that showed two different distinctive Betz cells shapes, one group located in the depth of the central sulcus next to area 3a being rounder than the group located more rostrally at the junction with area 6.
Therefore, in view of the complexity of the definition of architectural and functional limits for the human primary motor cortex and, in extenso, of area 4, we decided to keep in this study the definition of Brodmann's area 4 lamination patterns as a reliable delineation of the caudal boundary of primary motor cortex but we modified to some extent the definition of its rostral limit. This is important because it has been pointed out by many authors that Betz cells alone cannot be taken as a discriminating criteria for the rostral limit of area 4 (Wise, 1985; Zilles, 1990; White et al., 1997a; Geyer et al., 2000). In fact, their distribution may spread out on the anterior part of the precentral gyrus, in the caudal part of area 6.
3.3. Characteristics of Betz Cells versus Layer V Pyramidal cells
«Natürlich finden sich alle Übergange in Grösse und Form von diesen Reisenpyramiden einerseits zu den Betzchen Kolossalzellen, anderseits, wieder nach rückwarts zu den gewöhnlichen grossen Pyramidenzellen.»
«Im Einzelfälle ist es oft schwer zu unterschieden, zu welcher Gruppe das eizelne Individuum gehört , da alle möglichen Übergangstufen zu finden sind.»
(von Economo and Koskinas, 1925 [«We can find all the ranges of size and shape among the giant pyramidal cells on one hand to the colossal Betz cells on the other hand and back to the normally large pyramidal cells. (...) In a single case it is often difficult to differentiate to which group an individual cell belongs because all of the possible intermediate ranges can be found», author's translation]).
From the very first description of giant pyramidal cells by Betz (1874) to more recent studies, there has never been a clear morphologic distinction between Betz cells and their neighboring pyramidal neurons in layer Vb of primary motor cortex. As their name implies, the giant pyramidal cells of Betz were categorized initially by their size, ranging from as small as 30 mm x 10 mm to as large as 120 mm x 60 mm (Betz, 1874; Lewis, 1878; Lewis and Clarke, 1878; Hammarberg, 1895; Brodmann, 1909; von Economo and Koskinas, 1925; Conel, 1941; Kaplan, 1952; Glezer, 1959; Blinkov and Glezer, 1968). These discrepancies explain attempts to find specific morphologic features that distinguish Betz cells (Walshe, 1942; Scheibel and Scheibel, 1978), the pigmentoarchitectonic analyses performed by Braak and Braak (1976), and the characterization of inclusion bodies among the lipofuscin deposits in aging Betz cells (Tigges, 1992; Sasaki and Iwata, 2001), so as to be able to distinguish them from the other pyramidal cells in layer V. In view of the lack of definite criteria to recognize Betz cells from other pyramidal neurons in layer V, we had to consider for the present study a constellation of cytomorphologic characteristics that permitted us to discriminate these two subpopulations of neurons, without considering their size as a criterion (see Results). Our results showed that the Betz cells, as we defined them, are about 20 times larger than the other pyramidal cells. Nevertheless, even if a categorical overlap in Betz and pyramidal cells size is unavoidable, the percentage of Betz cell and pyramidal cell volume distribution in layer Vb clearly demonstrate a bimodal distribution of the cellular volumes in layer Vb of the primary motor cortex, thereby implying that two different populations of neurons coexist and that one of their distinguishing features is indeed their volume.
With respect to the total number of Betz cells per hemisphere, the values reported by Campbell (1905) and Lassek (1940) and Lassek and Wheatley (1945) represent underestimates by a factor of 3.6 in comparison to our results. These considerable discrepancies can be explained by the differences in the techniques used. Stereological analysis yields more accurate and unbiased estimates of neuronal counts compared to other quantification techniques (Howard and Reed, 1998). Our estimates reveal that about one tenth of all pyramidal cells in layer Vb of the primary motor cortex are Betz cells.
3.4. Betz Cell Distribution Patterns and Functional Anatomy
Betz cells distribution can be considered according to two different characteristics: their volume and their degree of clustering. The functional correlation between Betz cell volumes and the length of their projections was first made by Lassek (1939, 1940, 1954). Our results confirm that Betz cell volume is proportional to axonal projection length, as those located within the cortical domain corresponding to the motor representation of the leg and foot have the largest soma volumes. There does not appear from our findings to be another interpretation for these size differences.
Betz (1874), Lewis (1878), Ramòn y Cajal (1899, 1900) and Campbell (1905) noted that Betz cells are found in small clusters, heterogeneously scattered along layer V. A functional link for these clusters has not been discussed. We demonstrated that these clusters follow a specific distribution along the cortical motor strip. The classical motor representation of the «homunculus» (Penfield and Rasmussen, 1950), and more recent functional studies using modern techniques such as epicortical electrical mapping and functional MRI have pointed to the need for a microstructural basis for functional anatomical studies (White et al., 1997a,b; Geyer et al., 1999, 2000; Rademacher et al., 2001; Takahashi et al., 2002). Evidence of cytoarchitectonic differences in the cortical organization of the so-called «hand-knob», which is located on average about 23 mm from the midline, posterior to the junction of the superior frontal sulcus with the precentral sulcus and 19 mm from the lateral surface (Yousri et al., 1997; Boroojerdi et al., 1999; Pizzella et al., 1999), has never been clearly established (White et al., 1997a,b). Our data show a maximal clustering zone located approximately midway from the midline and Sylvian fissure, which, when illustrated on the cortical surface, defines a zone including the «hand-knob» in its range. There is no overlap between the zones of maximal volume and maximal clustering of Betz cells, suggesting the presence of different, independent modes (shape, size, and clustering) of functional organization in layer V of the primary motor cortex. Thus, this zone of maximal clustering containing approximately 6,800 Betz cells is likely related to the fine movements of the hand and wrist. Several factors, such as interindividual and sex differences in brain shape and primary motor cortex size, as well as postmortem tissue shrinkage must be taken into consideration to assess the precise localization of this zone (Pakkenberg and Gundersen, 1997; Zilles et al., 1997; Amunts et al., 2000). Also, the lack of antemortem functional studies does not allow us to match precisely this zone of maximal clustering with a functional area. Nonetheless, the present observations suggest that these different patterns of clustering follow an organized distribution along the human primary motor cortex and that they are highly correlated in each of our cases with the cortical region known to contain the motor representation of the hand (Yousry et al., 1997; Boroojerdi et al., 1999; Pizzella et al., 1999; Takahashi et al., 2002). Conversely, pyramidal cells in layer V do not show local patterns of distribution and form a rather homogeneous population, corroborating previous observations (Campbell, 1905; Brodmann, 1909; Lassek, 1940).
3.5. Betz cells, neurodegenerative diseases, and normal brain aging
There are only a few pathologies of the central nervous system involving the Betz cells in the first place. These are, for a large majority, neurodegenerative diseases targeting in a more or less specific way the primary motor cortex and its projections.
3.5.1. The example of amyotrophic lateral sclerosis and related diseases
It is unclear how severely Betz cells are affected in motor neurons degenerative diseases such as amyotrophic lateral sclerosis. Amyotrophic lateral sclerosis (ALS) is a progressive disease involving not only the motor system, but also several non-motor systems and subcortical areas (Lowe 1994; Ince et al., 1998), which can occur either sporadically or in a familial way. The physiopathological mechanism in ALS is the loss of the anterior horn cells and degeneration of the corticospinal tract with an involvment of the upper motoneurons. There are other neurodegenerative diseases comprised in the spectrum of ALS, for example the Guamanian amyotrophic lateral sclerosis/parkinsonism-dementia complex (Perl, 2001; Morris et al. 2001; Hof and Perl, 2002), a widespread disorder on the island of Guam in the Marianas archipelago involving the motor cortical pathways, and primary lateral sclerosis which involves only the upper motoneurons with a total loss of the Betz cells (Younger et al., 1988; Pringle et al., 1992; Rowland, 1994). Other related motor neuron diseases such as corticobasal degeneration, progressive supranuclear palsy and ALS with probable upper motor neuron signs will not be discussed here due to the lack of studies directed to the histopathological processes.
At the cellular cortical level, the reported degeneration of the dendritic arborizations, changes in synapses, and loss of Betz cells in amyotrophic lateral sclerosis and other degenerative illnesses involving the primary motor cortex suggest a participation of this neuronal subpopulation in the process of the disease (Hammer et al., 1979; Udaka et al., 1986; Kiernan and Hudson, 1991; Maruyama et al., 1992; Nimchinsky et al., 1992; Nihei et al., 1993; Sasaki and Maruyama, 1994; Pamphlett et al., 1995; Fujita et al., 1999; Sasaki and Iwata, 1999; Tsuchiya et al., 2000, 2002; Hof and Perl, 2002). The hypothesis that spinal motoneuronal degeneration is secondary to cortical transynaptic degeneration (Eisen et al., 1992), even if widely criticized (Pamphlett et al., 1995), has refocused the attention on the primary motor cortex as being possibly involved in lower motoneuron disease. Many authors have attempted to establish a relation between neuronal loss and shrinkage in the spinal cord and in large motoneurons in the primary motor cortex (Marie, 1928; Davison, 1941; Lawyer and Netsky, 1953; Kiernan and Hudson, 1991; Nihei et al., 1993; Pamphlett et al., 1995), trying to compare neuronal size between pathologic and control cases and to quantify the total number of motoneurons in different cortical and spinal regions. These studies have limitations in that the neuronal distribution patterns in layer V of the primary motor cortex were considered random and that estimates of neuronal sizes were expressed as diameters (i.e., in a two-dimensional plane based on variable criteria). In contrast, the Betz cells were shown in our study to be diverse in somatic volume and spatial organization. Gredal et al. (2000) used stereological methods to estimate total neuronal number in neocortex and in the motor cortex with the optical disector and estimated regional volumes using the Cavalieri principle. However, different subpopulations of neurons, such as the Betz cells, were not analyzed separately. In this regard, it would be informative to evaluate Betz cell loss and shrinkage in degenerative diseases affecting motoneurons using standardized and rigorous quantitative methods in postmortem human brains. Indeed, a limitation to this approach is that it requires access to whole specimens that can be adequately prepared and sampled according to stereologic principles (Perl et al., 2000).
3.5.2. Normal brain aging
The first to note a difference in Betz cells morphology during the lifespan was Ramòn y Cajal (1899, 1900) who noted a difference in length of Betz cells basal dendrites between newborns and adults brains, the latter having a greater dendritic length. More recent studies reported that in normal aging brains, Betz cells have reduced dendritic spines and are swelled; these age-related changes have been considered a possible correlate of the slowing of motor performance and agility, as well as increased stiffness during the lifespan (Scheibel et al., 1977), as Betz cells are preferentially involved in the tone of antigravity muscles (Lundberg and Voorhoeve, 1962; Evarts, 1965, 1967; Takahashi, 1965; Preston et al., 1967; Hore and Porter, 1972).A decrease in the size of Betz cell somata has been reported in normal adult rhesus monkeys, along with a progressive appearance of highly specific, age-related inclusion bodies scattered within their lipofuscin deposits (Tigges, 1992; Tigges et al., 1992). However, these data were not obtained using a stereologic approach, and they contradict previous observations of swelling of Betz cells during aging in humans (Scheibel et al., 1977).
The fact that Betz cells may be affected during aging is important considerig the fact that our study had access only to brains of elderly patients. It must be emphasized that although none of our cases suffered from motor deficits, it remains possible that a certain degree of dendritic or somatic attrition had occurred (Scheibel et al., 1977; Nakamura et al., 1985), which may have affected our estimates of Betz cells volumes. However, this is unlikely to have significantly affected this parameter, as the range of volumes that we obtained is well within that reported by previous authors in younger cases (about 25'000-113'000 mm3 (Kaplan, 1952; Glezer, 1959; Blinkov and Glezer, 1968)). Furthermore, the aging process most likely did not influence the total number of Betz cells (and of other pyramidal cells), because stereologic estimates of total neuronal numbers have failed to reveal cell loss in normal brain aging (Hof et al., 1999; Bussière et al., in press). Of note, the primary motor cortex is generally spared in Alzheimer's disease at least until the very late stages of dementia (Arnold et al., 1991), and pathological changes in large neurons are observed only in atypical cases with prominent motor symptoms (Golaz et al., 1992) or in cases with Guamanian amyotrophic lateral sclerosis/Parkinsonism-dementia (Hof and Perl, 2002). Finally, a recent investigation has shown the presence of inclusion bodies comparable to Bunina bodies in the Betz cells of aged normal human brains and also reported that some Betz cells contain lamellar inclusions (Sasaki and Iwata, 2001). We did not investigate the presence of such inclusions bodies in our materials. However, if these inclusions occur consistently in normal human brains, they could be used as an additional specific marker of Betz cells during aging. Defining the cytoarchitectonic boundaries of functional subareas within the primary motor cortex would also be important to develop refined clinicopathological correlations in the study of normal brain aging, amyotrophic lateral sclerosis, and other neurodegenerative disorders with motor cortex involvement such as progressive supranuclear palsy, corticobasal degeneration, Guamanian amyotrophic lateral sclerosis/parkinsonism-dementia complex and primary lateral sclerosis.
3.6. The Betz cells as a marker of brain evolution among the primates
Since the finding that the cortical volume of humans and great apes is probably not indicative of the degree of specialization and acquisition of specific skills as cognition (Semendeferi et al., 2002), the need for microscopic comparative studies among species closely related to human has emerged to analyze the connectivity and organization of the cerebral cortex. The human and primates brains are surprising by their similarities, and yet, their structure differ enough among different species to allow a comparative analysis so as to enable an evolutionary graduation of the cellular structures. To compare the same zones in different species is rather difficult because the chosen cytoarchitectonic criteria to define the different brain areas differ among different species. In addition, in order to compare properly the results from an evolutionary standpoint, the analyzed characteristic must show an homology in the ancestor and in all its descendents. Concerning the human Betz cell, a similar structure is found among the great apes in the giant pyramidal cells of motor cortex, thus allowing to perform evolutionary analyses (Sherwood et al., 2003).
In the primate brain, and especially in the macaques species, the subdivision between the primary motor cortex and the adjacent areas is as controversial as in the human species. The density of giant pyramidal cells in layer V similar to Betz cells in the human brain was first used as a criterion to define borders between areas (Brodmann, 1909; Barbas and Pandya, 1987) leading to evident inter-observer variation. More sensitive techniques used in recent years such as receptor autoradiographic mapping of the binding sites of classical neurotransmitters and immunohistochemical staining of neurofilaments proteins with SMI-32 antibody or cytoarchitecture (Matelli et al. 1991, 1996; Zilles et al. 1995; Geyer et al., 1996, 2000; Petrides et al., 2000) lead to define an agranular frontal isocortex, named F1 (rostral) to F7 (caudal), F1 being the equivalent of the primary motor cortex of human. The motor cortex of primates is known to have a somatotopic arrangement as first illustrated by the «motor simiusculus» of Woolsey (1952) which must be related to the «motor homunculus» of Penfield and Rasmussen (1952); however, these representations are a rather simplistic illustration of the intricated cortical circuits which preside to functional anatomy.
Giant pyramidal cells are found in layer V of F1 in primates brain. These cells are the equivalent of the Betz cells in humans, as they bear the same morphologic characteristics in terms of soma and dendrites shape and size (Palay, 1978). They are also stained with SMI-32 antibody which is a marker of phosphorylated neurofilaments and which detection in the cellular soma is correlated with neuronal and axonal size and with the conduction velocity (Hof et al., 1995) thus confirming the similarities with Betz cells (cf. supra).
Meynert cells are specialized pyramidal cells found in primary visual motor cortex (Brodmann's area 17) among primates and are characterized by unique dendritic arborization patterns and connectivity. Betz and Meynert cells are the ideal substrate to conduct interspecies comparative studies in terms of specific sensorimotor capacities among primates, in that they are easily recognizable and are representative of highly specialized subtypes of neurons. A recent study (Sherwood et al., 2003) compared the Betz and Meynert cells size of distinct primates species with their body weight, brain weight, neocortical volume and encephalization quotient (represented as a ratio of actual over expected brain weight). It appeared that the size of Betz cells was strictly correlated with these variables, and the volume of Betz cells was maximal in the Homo sapiens brain compared to other primate species. It also emphasized that there is an enlargement of Betz cells located in the cortical hand representation with the increase in body an brain size and also that Betz cell ratio is significantly correlated to digital dexterity among primates. From a phylogenetic standpoint, the latter results correlated with the difference in Betz cells clustering ratio along the human motor cortex found in this study (with the maximum in the hand representation zone) are highly suggestive of the need for a rearrangement of specific motor pathways directed to acquire new skills under the evolutionary pressure of these last 15-20 million years. This functional approach of brain development highlights the role of Betz cells in the specialization of neocortex in great apes and the need to consider them as a possible marker of the brain rearrangement in the acquisition of dexterity.
The only other cell subtype found in great apes and humans to the exclusion of other species is a large spindle cell located in the layer V of insular and anterior cingulate cortex (Nimchinsy et al., 1999). These spindle cells were shown to be found only in hominids (i.e., orangutans, gorillas, chimpanzees and humans) with the pigmy chimpanzees having the same cell amount and clustering degree as Homo sapiens. This finding suggests the emergence of these spindle cells as an evolutionary need considering that the cortical region where they are found is implicated in vocalization and voluntary phonation in great apes (Jürgens and Ploog, 1970; Trachy et al., 1981; Jürgens, 1998). These observations are of particular interest when considering primate neocortical evolution, as they reveal possible adaptive changes and functional modifications over the last 15-20 million years in the anterior congulate cortex. Furthermore, these spindle cells have been shown in humans to be severly affected in the degenerative process of Alzheimer's disease suggesting that some of the differential neuronal susceptibility that occurs in the human brain in the course of age-related illnesses may have appeared only recently during primate evolution (Nimschinsky et al., 1995; Morrison and Hof, 1997).
To the best of our knowledge, the Betz and spindle cells are almost the only neuron subtypes that can be considered as a marker of the evolution among the primates.
3.7. Perspectives for the future
In this study, we demonstrated the necessity to have modern techniques assessing the topographical distribution of Betz cells in that we barely begin to understand their functional role. Not only Betz cells are an unique neuronal subtype in man but they are also found in our closely related species, the great apes, attesting their role in the acquisition of new skills as they grow larger and are more densely connected as in Patas, gorillas and baboons, which are known for their high handskilfullness. The Betz cells are also particular in that they are directly targeted in a group of neurodegenerative diseases, such as SLA. It is interesting to note that Meynert cells and the large spindle cells of the anterior cingulate cortex are not involved in specific neurodegeneration in apes but that they are the target of neurodegenerative illnesses in man. These findings may represent the basis for additional studies assessing the effect of aging on these specialized neuron subtypes in great apes, to determine the evolutionary onset of human-like neuropathological aging. Moreover, the actual lack of studies assessing the morphology and distribution of Betz cells is puzzling in that they may be the missing link between some motor neuron degenerative diseases, the functional mapping of our cortex and the direct proof of the evolution of the primates as a need to develop specific hand skills. The precise characterization of Betz cell function, topography and functionality could lead to a better understanding of the organization of the primary motor cortex and its pathologies.