This document shows how SPSS appears on your screen and explains briefly the various elements (details can wait).
Let us start by examining a screenshot showing two different windows.
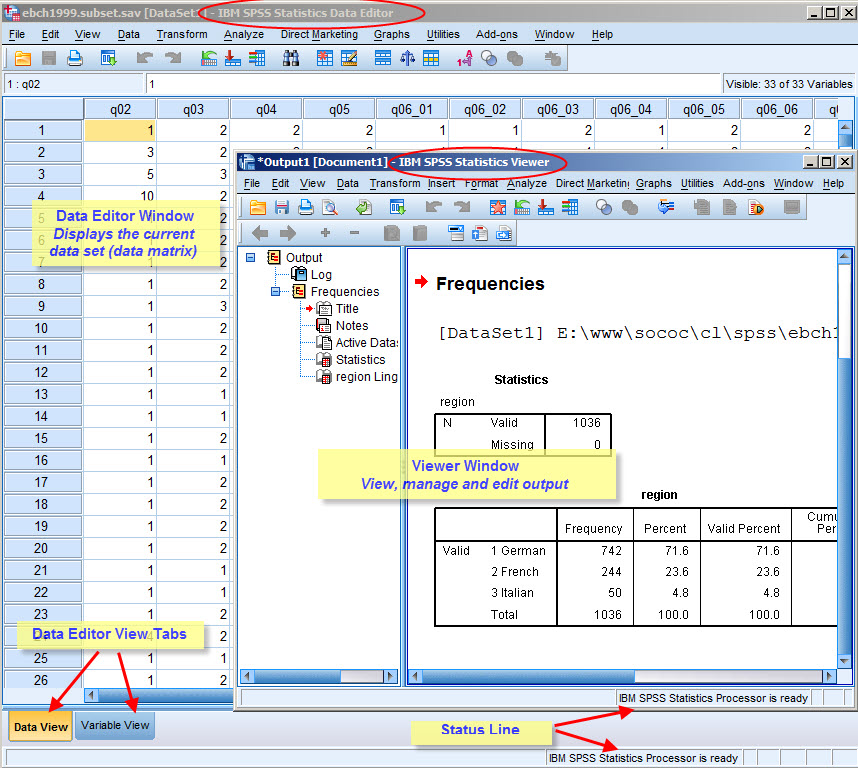
SPSS differs in one important aspect from other standard software like for instance a word processor or a spreadsheet: it always uses at least two distinct windows, a window that shows the current data matrix, called the (window) and a second window that contains the results from statistical procedures called the .
Although some menus are similar in all SPSS windows, each window type has its own menus and toolbars for tasks that are specific to the windows type.
The shows the contents of the currently active data set, i.e. the SPSS Data Matrix. In order to analyze a dataset it must be visible in a window.

It displays the current and the window lets you, if required, edit the data. Although the looks like a spreadsheet, it is not a spreadsheet in the sense that you cannot use it e.g. to add totals and subtotals, use formulae to create additional columns or add graphs; it is just a visual display of the data and an editor that lets you, if needed, modify the data and perform other editing tasks.
The name at the head of each column is the , i.e. the name you will use to refer to a variable in the various commands you will learn to use.
The Window has two distinct views, accessible through the tabs at the bottom of the Data Editor window, i.e. the and the . The Data View of the current dataset (also called the active file) is shown above; the variable view can be seen below:
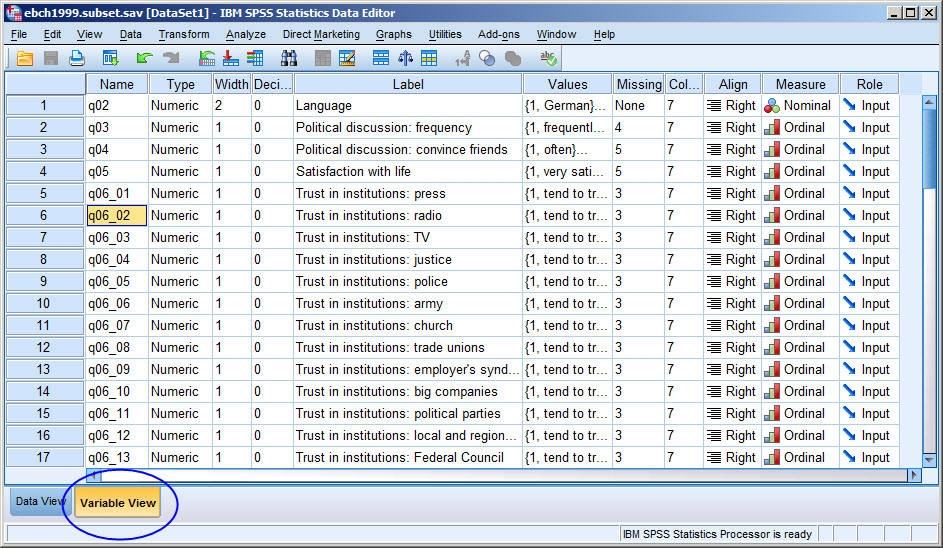
The shows the for each variable in the dataset: descriptive labels for variables (), and values (codes, categories) (), missing value declarations and some other, for now, less important properties like variable type and display formats. You might use this view to edit the various elements shown. For the moment this aspect is not important, we only use the window to see what variables are available, namely their names and the descriptive lables.
Note that if you modify the contents of the data editor (you will learn to create new variables etc later), you will need to save it, if you want to keep the changes permanently. SPSS works in this respect the same way as e.g. Word or EXCEL...
Results produced from data (e.g. tables, charts) are shown in a separate window, the window. As you will discover later, it is far more than its name suggests: it is a viewer for results produced by SPSS, but it is also a powerful output editor and manager, with tools for rearranging graphics and tables, producing production quality statistical output (to be printed on paper or published on the Internet) together with your own texts and annotations.

The screen shot shows the results of a Frequency command; the window has two parts, a navigation pane to the left that shows a list of the various elements you find in the right hand pane, i.e. the actual output produced. The navigation pane can be used to navigate to the various elements; it can also be used to manage the various elements, i.e. you can move them, delete them etc.
When leaving SPSS you will be prompted to save the contents of the Viewer window; if desired save it to a file (but in many situations it is unlikely that you want to keep everything you have produced during a session).
As you will learn later, several and windows can be open at the same time, and when you are a bit more advanced you will learn to use the window for writing SPSS commands.