Regression: Analysis of residuals
Regression statistics: Statistics
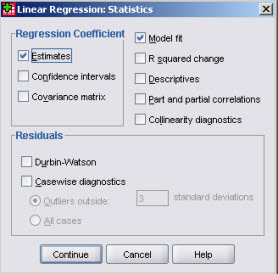 The Statistics button offers two statistics related to residuals, namely casewise
diagnostics as well as the Durbin-Watson statistic (a statistic used with time series
data). Caswise diagnostics lets you list all residuals or only outliers (defined based on standard deviations of
the standardized residuals).
The Statistics button offers two statistics related to residuals, namely casewise
diagnostics as well as the Durbin-Watson statistic (a statistic used with time series
data). Caswise diagnostics lets you list all residuals or only outliers (defined based on standard deviations of
the standardized residuals).
Residual plots
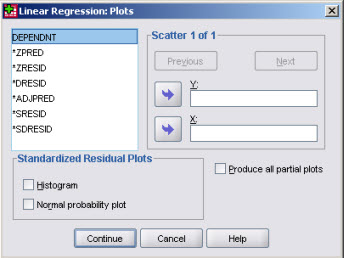 The Linear Regression Plots button displays
a dialogue that lets you build a series of plots combining
a number of internal derived variables that are automatically produced by the
regression; these variables are - with the exception of DEPENDENT - all some form
of either residual or fitted value.
The Linear Regression Plots button displays
a dialogue that lets you build a series of plots combining
a number of internal derived variables that are automatically produced by the
regression; these variables are - with the exception of DEPENDENT - all some form
of either residual or fitted value.
You can combine any of those and produce several
plots using the same dialog.
The names correspond to:
- DEPENDNT: the dependent variable
- *ZPRED Standardized predicted values
- *ADJPRED Adjusted predicted values
- *ZRESID Standardized residuals
- *DRESID Deleted residuals
- *SRESID Studentized residuals
- *SDRESID Studentized deleted residuals
Further plots can be produced by selecting the appropriate option, namely
- Normal probability plots for assessing normality of the residuals
- Partial residual plots
- Histogram of the residuals for assessing symmetry and others aspects of
the distribution of the residuals.
Note that the "variables" listed above are not available outside the Regression procedure
unless you copy them explicitely as variables to the data matrix.
The plots provided are a limited set, for instance you cannot obtain plots with
non-standardized fitted values or residual.
In many situations, especially if you would like to performed a detailed analysis of
the residuals, copying (saving) the derived variables lets use these variables with
any analysis procedure available in SPSS.
Saving derived variables
 In order to append residuals and other derived variables
to the active dataset, use the SAVE button on the regression dialogue.
When the regression procedure completes you then can use
these variables just like any variable in the current data matrix, except of course their purpose is regression
diagnosis and you will mostly use them to produce various diagnostic scatterplots.
In order to append residuals and other derived variables
to the active dataset, use the SAVE button on the regression dialogue.
When the regression procedure completes you then can use
these variables just like any variable in the current data matrix, except of course their purpose is regression
diagnosis and you will mostly use them to produce various diagnostic scatterplots.
These variables have names like
PRE_1 and a label of "Unstandardized Predicted Value"; if after a first
regression you run a second you will produce a PRE_2 variable and so on.
If you run many regression or save the data matrix for later use, make sure to remember what regression
produced what derived variable, i.e. to avoid confusion change the variable name and label to reflect
the model, for instance "pred-InfMort = f(urb,gnbcap)" or a more readable label if you plan to
publish a graph produced with these variables.
General remarks
- The regression syntax has more options, and is also more flexible, especially for requesting
various regression plots.
Related documents