Outliers in SPSS
Before reading on you should be familiar with the terminology and definition of outliers.
On the boxplot shown here outliers are identified, note the different
markers for "out" values (small circle) and "far out" or as SPSS calls them "Extreme values" (marked with a star). SPSS uses a step of 1.5×IQR (Interquartile range).
For simple diagnostic purposes the boxplot is sufficient, but often, for instance if you wish to exclude outliers from analysis, you need to be able
to specify selections based on numerical criteria that define outliers.
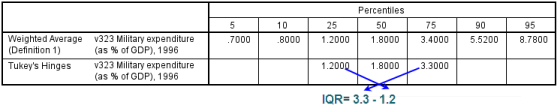 has an Percentiles options (Statistics button), displaying the table shown, producing
the statistics required to define numerically the fences. The interquartile range IQR can be computed as shown (difference between Q3 and Q1). Use Tukey's hinges,
as boxplots are based on this definition of a quartile.
has an Percentiles options (Statistics button), displaying the table shown, producing
the statistics required to define numerically the fences. The interquartile range IQR can be computed as shown (difference between Q3 and Q1). Use Tukey's hinges,
as boxplots are based on this definition of a quartile.
Given these elements (Q3, Q1, and a step of 1.5×IQR) we can identify numerically outliers specifying the conditions using SPSS
style logical expressions.
Frequently me might want to exclude all outliers form analysis, i.e. we do not care to distinguish two types of outliers (out values and extreme (far out) values): we wish to include
into analysis all observations inside the inner fences (example of the variable used as illustration above)
| Condition | Logical expression |
|---|
| xi ≥ Q3+step | V323 ≥ 3.3 + 1.5*2.1 |
| xi ≤ Q1-step | V323 ≤ 1.2 - 1.5*2.1 |
These conditions define what an outlier is, to include values that are not outliers the following logical expression is to be specified:
(V323 > 1.2-1.5*2.1) AND (V323 < 3.3+1.5*2.1)
Logical conditiond corresponding to far out (extreme) outliers are similar:
| Condition | Logical expression |
|---|
| xi ≥ Q3+ 2×2.1step | V323 ≥ 3.3 + 2*1.5*;2.1 |
| xi ≤ Q1- 2×2.1step | V323 ≤ 1.2 - 2*1.5*2.1 |
Related documents