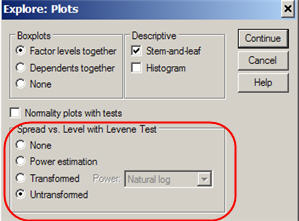
 From the dialog in
you can request
a spread-and-level plot.
From the dialog in
you can request
a spread-and-level plot.From the dialog in
you can request
a spread-and-level plot.
The spread-and-level plot (S-L plot) is a diagnostic plot (guidance plot) that helps you promote equal spread and symmetry among groups of a factor (group) variable through an appropriate transformation.
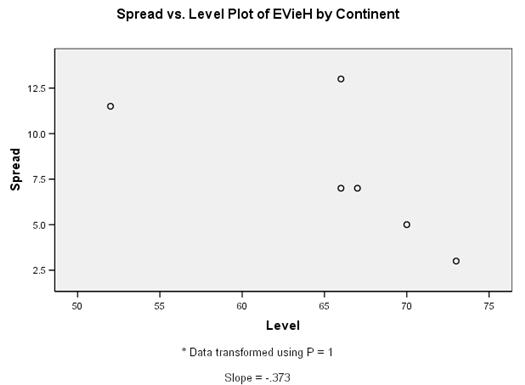 The transformation that would do that can be found by considering the slope
of a resistant line going through the spread-and-level plot; the slope is shown at the bottom of the plot.
The transformation that would do that can be found by considering the slope
of a resistant line going through the spread-and-level plot; the slope is shown at the bottom of the plot.
As seen from this table, the translation from the slope to the appropriate power transformation is straightforward.
| Transformation | Power | Slope of S-L plot |
|---|---|---|
| Cube | 3 | -2 |
| Square | 2 | -1 |
| No change | 1 | 0 |
| Square root | ½ | ½ |
| Log | 0 | 1 |
| Rec. root | -½ | 1½ |
| Reciprocal | -1 | 2 |
If you select "Power transformation" that plot is based on the natural logs of spread (medians) and level (midspreads) and the power transformation is directly given. Other transformations of the data before plotting are also possible.
Important: This is only a diagnostic plot, i.e. if you need the transformed variable you will have to produce it using SPSS transformation commands.