 Using Enter the value to assign to PM, then
click to open the dialog that lets you enter the logical
expression.
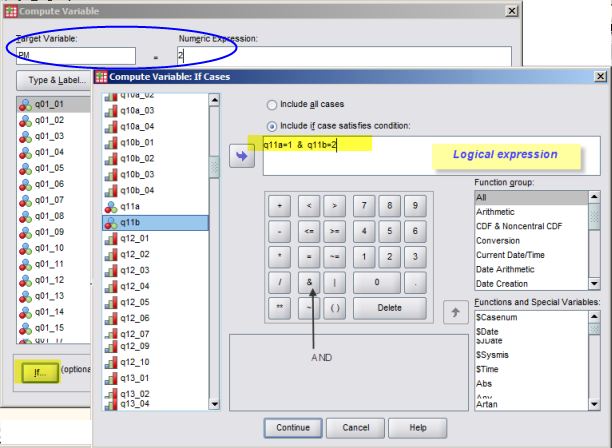
Using Enter the value to assign to PM, then
click to open the dialog that lets you enter the logical
expression.This example uses only SPSS (syntax)
Ronald Inglehart in his The Silent Revolution (Princeton 1977) formulates a theory that postulates a irreversible change of value priorities in post-industrial societies, i.e. we are, as he says, moving from a society based on materialistic values towards a society, where postmaterialistic values are becoming more important.
He proposes to measure whether people tend to be more materialistic or postmateralistic by asking people about the priorities in what their country/government should do in the future and build, from the answers, an index (scale).
In the questionnaire used for the example here (Eurobarometers in Switzerland) the following priorities were proposed:
Respondents were asked to select their first priority from the list and then a second. The first and third items are considered materialist, items 2 and 4 as post-materialist. A respondent selecting both materialist items is qualified as materialist; if the first item is materialist and the second post-materialist, the person is "rather materialist, and so on.
In order to build the scale we need to create a new variable that reflects, for each individual, his or her position on the "post-materialism" scale, i.e. one out of four possible scores:
The following table shows this in a more concise form (the scores for all combinations of rows and columns are shown in the table)
| First priority q11a | "2nd Priority
q11b |
(1) Maintain order |
(2) More to say | (3) Fight raising prices |
(4) Freedom of speech |
|---|---|---|---|---|
| (1) Maintain order | - | 3 | 1 | 3 |
| (2) More to say | 2 | - | 2 | 4 |
| (3) Prices | 1 | 3 | - | 3 |
| (4)Freedom speech | 2 | 4 | 2 | - |
This table tells you in fact what you have to do, just translate, for instance:
This condition translates readily into an SPSS command:
IF q11a=1 AND q11b=2 PM=2.
The highlighted part corresponds to a Instead of using the IF command you can of course use the menu instead.
Using Enter the value to assign to PM, then
click to open the dialog that lets you enter the logical
expression.
This has to be repeated for all cells in the table above, i.e. you need to write a sequence of conditions (either write a command in a syntax window or call up a dialog using ).
Below you will find all conditions, shown using SPSS syntax.
IF q11a=3 AND q11b=1 pm1=1.
IF q11a=1 AND q11b=3 pm1=1.
IF q11a=1 AND q11b=2 pm1=2.
IF q11a=3 AND q11b=2 pm1=2.
IF q11a=1 AND q11b=4 pm1=2.
IF q11a=3 AND q11b=4 pm1=2.
IF q11a=2 AND q11b=1 pm1=3.
IF q11a=4 AND q11b=1 pm1=3.
IF q11a=2 AND q11b=3 pm1=3.
IF q11a=4 AND q11b=3 pm1=3.
IF q11a=2 AND q11b=4 pm1=4.
IF q11a=4 AND q11b=2 pm1=4.
If you prefer to use menus, you will have to specify only the conditions in the dialog box, as well as indicate the value (score) the scale (target variable) has to take.
You can specify the conditions in a more compact form, an expression for each of four the PM values.