 ,
then from the scatterplot selection pane
select
,
then from the scatterplot selection pane
select  and
in the variable dialog panel specify variables for the X, Y and Z axes.
(All fields and options are otherwise identical to the simple scatterplot dialog).
and
in the variable dialog panel specify variables for the X, Y and Z axes.
(All fields and options are otherwise identical to the simple scatterplot dialog).Three dimensional scatterplots (3D plots) might be useful to discover relationships between three variables at the same time.
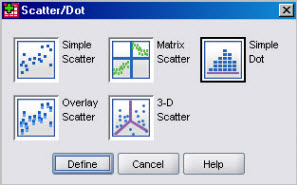
3D-Scatterplots are produced either with the or the . Some analysis commands, e.g. Factor Analysis also produces 3D plots when more than two factors are exctracted.
,
then from the scatterplot selection pane
select and
in the variable dialog panel specify variables for the X, Y and Z axes.
(All fields and options are otherwise identical to the simple scatterplot dialog).
Drag the 3D chart type from the to the preview pane, and fill in the variables as appropriate.
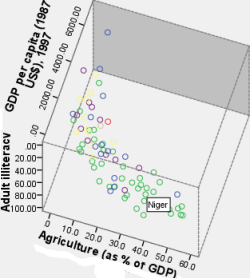 A double-click on the 3D chart (example shown) opens the
. You then can, as on most charts, identify observations and change various aspects of the chart (titles, labels, axes, colours etc)
A double-click on the 3D chart (example shown) opens the
. You then can, as on most charts, identify observations and change various aspects of the chart (titles, labels, axes, colours etc)
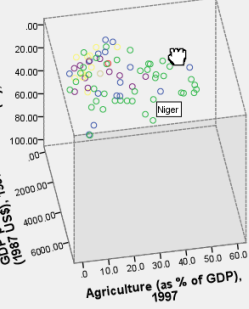 To rotate the chart, select to turn rotation mode on;
the cursor will then change to the
To rotate the chart, select to turn rotation mode on;
the cursor will then change to the
 (hand tool). Now while holding the mouse button down you can rotate the chart in the direction you move that hand (note that
the hand changes when the mouse button is held down.
(To go back to normal selection mode, deselect rotation in)
(hand tool). Now while holding the mouse button down you can rotate the chart in the direction you move that hand (note that
the hand changes when the mouse button is held down.
(To go back to normal selection mode, deselect rotation in)
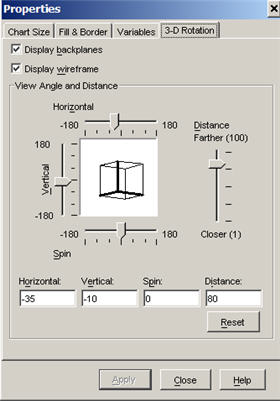
SPSS also displays a small window showing that lets you modify horizontal and vertical viewing angles precisely (just type them in and watch the chart rotate; there is also a reset button, to go back to the initial positions.
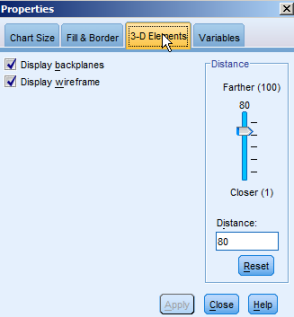 The 3-D Elements tab of the Properties window, lets you define the viewing distance, and turn on and off backplanes (the solid "wall" behind the chart,
as well as the wireframe (the frame around the 3D cube).
The 3-D Elements tab of the Properties window, lets you define the viewing distance, and turn on and off backplanes (the solid "wall" behind the chart,
as well as the wireframe (the frame around the 3D cube).
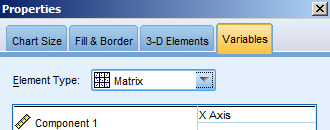 If finally you prefer a 2D dimensional representation of the three variables,
select, as shown Matrix in the Variables tab and you will get a scatterplot matrix for the variables.
If finally you prefer a 2D dimensional representation of the three variables,
select, as shown Matrix in the Variables tab and you will get a scatterplot matrix for the variables.
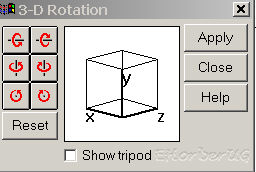
 In earlier versions of SPSS, rotation was performed somewhat differently, a Properties tab¨
3D Rotation was used to
rotate and manipulate the scatterplot.
In earlier versions of SPSS, rotation was performed somewhat differently, a Properties tab¨
3D Rotation was used to
rotate and manipulate the scatterplot.
This panel contains tools that you can use to control the rotation: Use the different controls to orient the cube in the properties box, then to visualize the effect on the chart.
 In still earlier versions there was a rotation panel.