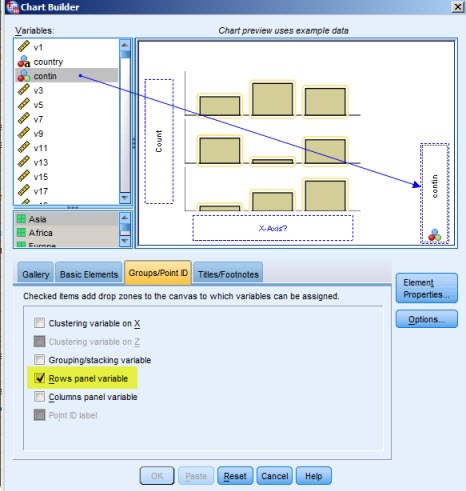
 For any graph type you can choose - from the Groups/Point Id
options - to add panel variables; the preview then shows an additional drop zone for dropping a categorical variable.
For any graph type you can choose - from the Groups/Point Id
options - to add panel variables; the preview then shows an additional drop zone for dropping a categorical variable.Most graphical commands (histograms, scatterplots, boxplots etc) let you produce panels (also called conditional plots, co-plots, plot matrices, trellis plots), i.e. an organized panel (collection) of separate plot for each group defined by the categories defined of one or more categorical (panel) variables; the individual plots can be presented horizontally or vertically or both if you specify more than one panel variable.
A word of caution: Each plot of a panel corresponds to a group defined by the panel variable(s), i.e. the total number of observations is distributed into the various plots. This means, unless the number of observations is very big, that you might quickly end up with individual plots that contain very few data points.
For any graph type you can choose - from the Groups/Point Id
options - to add panel variables; the preview then shows an additional drop zone for dropping a categorical variable.
 Standard graphs [The screenshot shows the histogram dialogue as an
example] have a Panel by section in their
dialogue that lets you specify row and column variables for the panel to be produced.
Standard graphs [The screenshot shows the histogram dialogue as an
example] have a Panel by section in their
dialogue that lets you specify row and column variables for the panel to be produced.
 GRAPH
  /HISTOGRAM=literacy
  /PANEL ROWVAR=Continent ROWOP=CROSS .
For details check the SPSS manual or on-line help.
The appearance of a panel plot produced using either the Chart Builder or a legacy plot command can be changed using the .
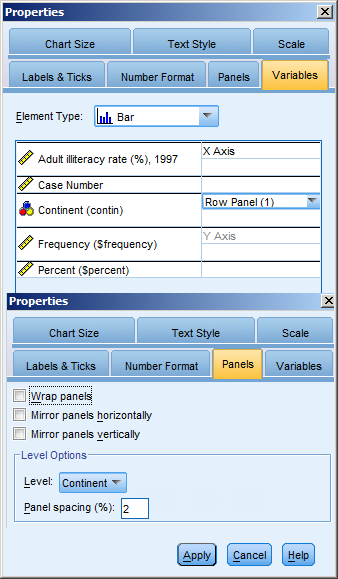 Besides changing colours, fonts etc, you can also change the way the individual
plots are presented in the panel. Click on the plot area to open the
Properties sheet.
Besides changing colours, fonts etc, you can also change the way the individual
plots are presented in the panel. Click on the plot area to open the
Properties sheet.
The
The Panels tab has further options, where you can for instance wrap a row category, instead of presenting it as a single panel row.
If one of the tabs is not shown on the property sheet you did not click the appropriate spot on the graph (properties change with the kind of element that is designated by clicking on the various parts of a plot.
 To the left you can see several forms of presentations.