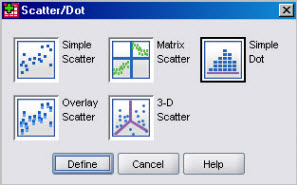
 The
menu produces a number of different scatterplots,
namely simple scatterplots.
When selecting Simple Scatter this dialog will come up.
The
menu produces a number of different scatterplots,
namely simple scatterplots.
When selecting Simple Scatter this dialog will come up.The
menu produces a number of different scatterplots,
namely simple scatterplots.
When selecting Simple Scatter this dialog will come up.
(In SPSS versions earlier than 15 use ).
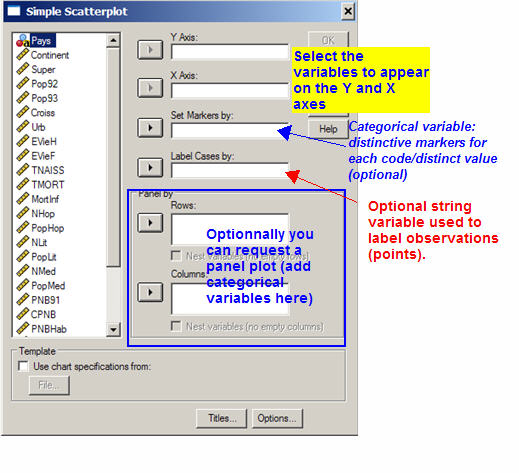 The minimal requirements are variables for the X and Y axes; all
other fields are optional.
The minimal requirements are variables for the X and Y axes; all
other fields are optional.
If you plan to add a regression line later take care to place the dependent variable on the Y-Axis, the independent on the X axis.
If you would like to be able to label or identify individual observations on the scatterplot and have an id variable (e.g. country or canton names), use it to Label Cases By.
Finally you might want to differentiate observations using different markers for groups of a categorical variable, e.g. continents for a country data set. Use Set Markers by to specify it. The will let you change various marker properties (style, colour etc).
and lets you add titles and request for instance Display chart with case labels.
You can add elements or change various aspects of the graph by invoking the (double-clicking the chart in the Viewer). Specific aspects related to scatterplots are documented .