
- Equal Width Intervals defines evenly spaced intervals. Fill in either the width or the number of intervals.
- Equal percentiles on scanned cases defines groups/classes with roughly the same number of observations. Fill in either the number of cutpoints or the %width by entering the percentage of cases in each group. For example if you indicate 3 cutpoints or 25% of the cases, you will create four groups containing each one fourth of the observations.
- Cutpoints at mean/standard deviations: Define a cutpoint at the mean and at ± 1,2 or 3 standard deviations.
- Then
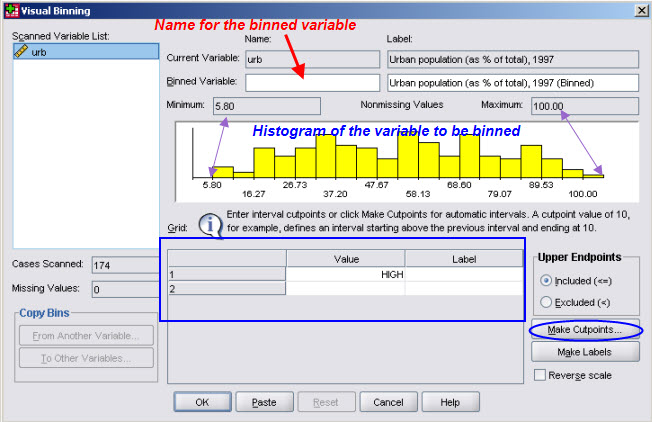
 The Visual Binning panel now appears as shown: the bins (interval borders) have been filled in,
according to the rules you just specified. Note that HIGH simply means
up to the highest value of the variable.
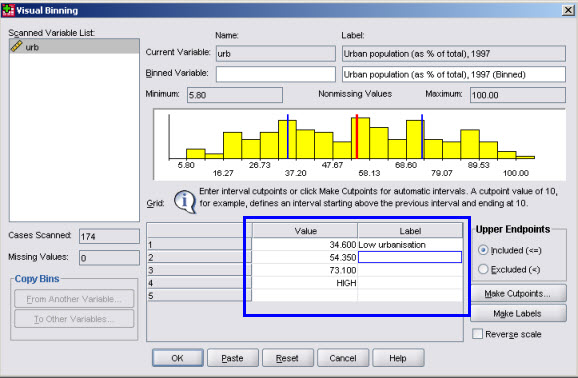
The Visual Binning panel now appears as shown: the bins (interval borders) have been filled in,
according to the rules you just specified. Note that HIGH simply means
up to the highest value of the variable.
It is strongly recommended to fill-in value labels for the intervals (the first label has been added as an example.
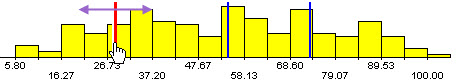 If you wish you can also move bin borders interactively, by just grabbing and
moving the limit:
If you wish you can also move bin borders interactively, by just grabbing and
moving the limit:
Related documents