EPDIC-7,
Barcelona, May 2000
Powder Pattern Decomposition with the Aid of Preferred Orientation –
Use of whole Debye-Scherrer Ring
R. Cerny
Laboratoire
de Cristallographie, Université de Genève, 24 Quai E. Ansermet, 1211 Genève 4,
Switzerland
Keywords : Powder Pattern Decomposition, Preferred Orientation, Image Plate
Abstract. Method of the
decomposition of overlapping reflections in a powder pattern with the aid of
preferred orientation is tested on magnetically aligned samples using the
effect of easy magnetization direction in hexagonal SmCo5 and TbCo5.
Complete Debye-Scherrer rings, measured with an image plate detector, are
integrated in different radial directions. The texture aided powder pattern
decomposition results in correct values of structure amplitudes.
Introduction
Powder
patterns collected at various values of a parameter which influences either the
position or the intensity of a reflection can be used for the separation of
overlapping profiles in the powder pattern. Preferred orientation (texture),
which changes the intensity of reflections in a controlled manner, is an
example of such parameter. The method is presented in [1], and an example of
its application to a zeolite structure with 69 non-H atoms in the asymmetric
unit is given in [2]. Another application using a simple empiric function for
the preferred orientation correction is given in [3]. The texture aided pattern
decomposition can be used with any type of the texture that is strong enough.
It can be introduced by any suitable way. A uni-axial texture (distribution of
a pole HKL has an axial symmetry in the sample coordinate system)
introduced by a packing effect of grains with an anisotropic shape (plates or
needles) was used in [3]. Different appearance of the texture in powder
patterns was realized with a texture attachment allowing the c-inclination of the sample. The sample spinning
has induced the axial symmetry of the pole distribution function. However,
significant deviations of the texture from the uni-axial type were found.
Especially the deviation from the so-called disc- or rod-shaped behavior of the
crystallites (equal probability of all crystallite orientations around any pole
HKL; see Condition II. in [4]; see
also [5]) was considered as the main reason of the method failure. The texture
of magnetically aligned powders is closer to an ideal uni-axial model, because
only one direction – easy magnetization direction (EMD) – tends to orient
preferentially (parallel to the magnetic field). When the texture axis is not
parallel to the primary beam, the texture effect is visible as the intensity
distribution on each Debye-Scherrer (DS) ring. Measurement of the whole DS ring
and use of a two-dimensional detector accelerates considerably the data
collection, as all information necessary for the pattern decomposition method
is included in one image. The inclination angle c corresponds to the declination
angle β measured from the vertical direction on the image. We have tested the
method with magnetically aligned SmCo5 and TbCo5 and the
image plate detector.
Theory
Correction
for preferred orientation [4]
Let
the distribution of poles HKL in a
coordinate system of the sample be described by a function PHKL(r =
x,y,z) with one maximum in a general direction (Fig. 1). The distribution of
poles hkl of any other plane, which
makes only one angle fH,h with HKL,
is given by
Phkl (r0)
= (1 / 2p sin fH,h) PHKL (r) ds (1)
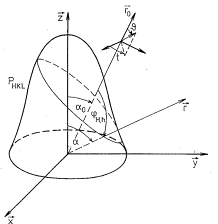 where the integration is done along the closed curve, where are the
poles HKL, which make the angle fH,h with the pole hkl lying in the direction r0. If the function PHKL(r) is known, the function Phkl (r0)
for any direction r0 making an angle 0 with the direction of the maximum of PHKL(r)
can be calculated. Regardless of the original shape of PHKL(r),
the function can be axially symmetrized by rapid sample spinning around one
axis.
where the integration is done along the closed curve, where are the
poles HKL, which make the angle fH,h with the pole hkl lying in the direction r0. If the function PHKL(r) is known, the function Phkl (r0)
for any direction r0 making an angle 0 with the direction of the maximum of PHKL(r)
can be calculated. Regardless of the original shape of PHKL(r),
the function can be axially symmetrized by rapid sample spinning around one
axis.
Figure 1. Schematic drawing of
a pole
distribution function PHKL.
The
function PHKL(r) can have the form :
PHKL (a) =
A exp (- G (1 - cosn a)) (2)
where
a is
the angle between the spinning axis (preferred orientation axis) and r, G and n are free parameters, and A
is the normalization constant. The case when the maximum (or minimum) of PHKL (r)
is inclined from the spinning axis, so-called inclined texture, can be treated by
integration of Eq. 1 around the spinning axis [4].
Pattern decomposition
using preferred orientation [3]
The factors in the formula for the intensity of a reflection hkl which depend on the orientation of
the diffraction vector with respect to the sample coordinate system (in our
case on a0 - the angle between the diffraction
vector and the preferred orientation axis) are: the absorption correction A and
the preferred orientation correction Phkl. The first term can be calculated, and parameters of unknown correction
Phkl can
be determined from the ratio of intensities of non-overlapping reflections
measured at different sample orientations (different angles a0i in
our case).
Once the correction for preferred orientation Phkl is
known for each reflection hkl and each sample orientation, the cluster
of n overlapping reflections can be
decomposed into individual intensities Ij (j = 1, n) if m cluster intensities Itot i
(m ≥ n) measured at m
different sample orientations (different angles a0i in our case) are available giving a system of m linear equations for n
unknowns :
Itot (a01) = I1 (a01) + I2 (a01) + ... +
In (a01)
Itot (a02) = I1 (a02) + I2 (a02) + ... +
In (a02)
............................................................................. m ≥ n (3)
Itot (a0m) = I1 (a0m) + I2 (a0m) + ... +
In (a0m)
Experimental
The
method was tested on hexagonal (P6/mmm) SmCo5 (a = 5.0271, c = 3.9899 Å) and TbCo5 (a = 4.9765, c = 3.9952 Å). Both compounds are
magnetically ordered. While SmCo5 has EMD in the c-axis
direction (axial), TbCo5 has EMD perpendicular to the c-axis
(basal), i.e. any vector in the basal plane. Fine powders of each compound were
loosely enclosed in glass capillaries (0.5 mm diameter), which ensure that
particles can re-orient under the magnetic field. A permanent magnet (Nd2Fe14B)
oriented vertically, perpendicular to the capillary axis, was used to create
the magnetic field of 0.3-0.5 T. All patterns were measured at the
Swiss-Norwegian beam line (ESRF Grenoble) (l = 0.7995 Å, beam-size 0.6 x 0.6 mm) using MAR345 image plate (sample-IP
distance 140 mm, exposition time 360 s). The images measured with the magnetic
field show clearly the intensity distribution on DS rings due to the strong
texture (Fig. 2).
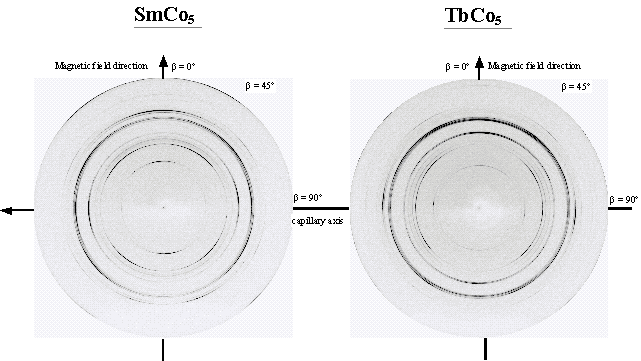
Figure 2. Images of
diffraction patterns of magnetically aligned SmCo5
and TbCo5 (MAR345 image plate, Swiss-Norwegian beam line at the ESRF
Grenoble, l = 0.7995 Å, beam-size 0.6 x 0.6 mm, sample-IP distance 140 mm,
exposition time 360 s).
The
images were integrated in seven different radial directions with different
declination angles β (0, 15, 30, 45, 60, 75 and 90°) by using a program
FIT2D (ESRF Grenoble). Resulting two-dimensional powder patterns were corrected
for the absorption effect (μ = 1 mm-1) using the formula given
in the Fig. 3, which includes the dependence of the absorption correction on
the off-equatorial position of the diffracted beam (generalization of the Eq. 2
in [6]). Corrected powder patterns (given in Fig. 4) were decomposed by Le Bail
method using the program FULLPROF [7]. After that the decomposition of the
overlapping reflections (closer then FWHM) was re-calculated by using the texture
aided method described above. Pole 00l was chosen as the preferentially
oriented pole HKL. The resolution in the orientation space was set to
4°, according to tests on simulated patterns [3]. The success of the pattern
decomposition was estimated from the comparison of the observed squares of
structure factors F2obs (obtained from the pattern
decomposition) and calculated ones F2calc (obtained from
the known structural model and put on the same scale as observed data). The
results are given in Fig. 5.
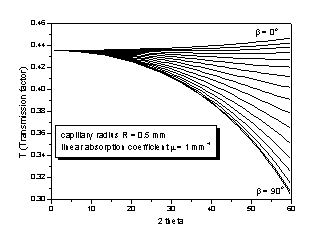 T = 1/πR2
∫0R r
∫02π exp[-μ(L + L’ sec
α)] dυ dr
T = 1/πR2
∫0R r
∫02π exp[-μ(L + L’ sec
α)] dυ dr
L = [R2 – (r sin υ)2]1/2 +
r cos υ
L’ = [R2 – (r sin (φ – υ))2]1/2
- r cos (φ – υ)
tan φ = tan 2θ cos β
sin α = sin 2θ sin β
T – transmission factor
R – capillary radius
μ – linear
absorption coefficient
θ – Bragg angle
β – declination
angle
Figure 3. Transmission factor T
for the case of a capillary with the diameter smaller than the primary beam.
β is the declination angle measured on the DS ring (off-equatorial
position of the diffracted beam). β = 0 corresponds to the vertical
direction, capillary is horizontal.
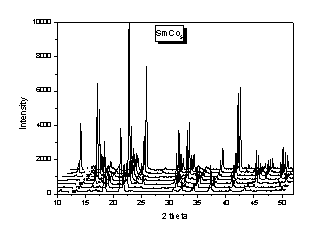
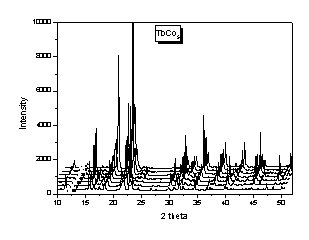
Figure 4. Powder patterns as obtained by the integration of images in different
radial directions and corrected for the absorption effect. β = 0º
corresponds to the vertical direction (magnetic field direction).
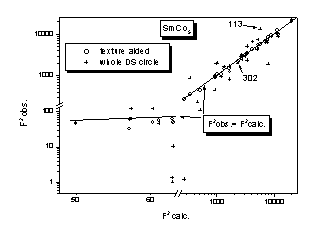
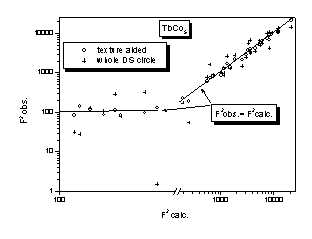
Figure 5. Observed (F2obs)
vs. calculated (F2calc) values of squares of structure factors.
Discussion
One can see from the Fig. 5 a good success of
the texture aided pattern decomposition. We have drawn for the comparison results
of the decomposition when no texture information is used, and the integration
of the images is performed on whole DS rings. The decomposition in that case
yields the F2obs, which are less reliable. The reasons
are two: i) the texture is not completely eliminated by the integration around
whole DS ring, ii) the decomposition suffers from the peak overlap. The success
of texture aided pattern decomposition is demonstrated on two strongly
overlapping SmCo5 reflections 113 and 302 given in Fig. 6. As one
can see from the Fig. 5 the F2obs values of these two
reflections as resulting from the decomposition are far from their correct
values if no texture information is used.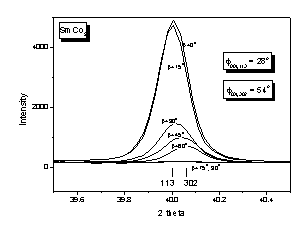
Figure 6. Two SmCo5 overlapping reflections (113 and 302)
measured at different
declination angles β. The angle
Φ between the
preferentially oriented pole HKL
(00l in this case) and
the pole hkl is given for
both reflections.
The preferred orientation of both samples can be
correctly described by the uni-axial texture using a simple empiric function.
Calculated 00l pole figures are given in Fig. 7. One can see that the
model of the uni-axial texture with the maximum of the 00l pole
distribution inclined by 90° with respect to the texture axis describes
correctly the expected distribution of the 00l poles of TbCo5
in the magnetic field. The correctness of the uni-axial texture model in both
samples is further confirmed by the correct values of F2obs
obtained from the pattern decomposition
using that texture model.
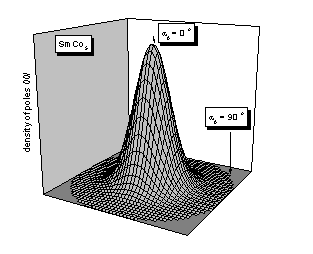
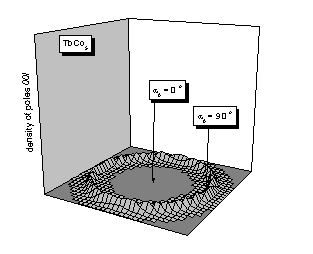
Figure 7. Calculated pole
figures 00l for SmCo5 resp. TbCo5 corresponding to
the axial resp. basal plane EMD. The parameters of the Eq. 2 are G = 19, n = 2
in both cases. The case of TbCo5 was modeled as an inclined
uni-axial texture with the inclination angle of 90°.
Two impurities were observed in the powder patterns
of both samples: hexagonal and rhombohedral Sm2Co7 and Tb2Co7.
We have tried the texture aided decomposition of peaks of the main phase (SmCo5
or TbCo5), which overlap with those of the impurities, using the
texture of all three phases. The method, however, did not result in correct
values, because the texture of impurity phases was not strong enough (G = 2).
The contribution of impurity phases to the intensity of the measured patterns
was therefore subtracted by using their known structural models.
Conclusions
Compounds
showing EMD can be textured by a homogeneous magnetic field. The resulting
texture is uni-axial and can be correctly described by a simple empiric
preferred orientation function. Two compounds, hexagonal SmCo5 and
TbCo5, were magnetically aligned. SmCo5 shows the axial
EMD and the resulting uni-axial distribution of the poles 00l has its
maximum in the direction of the magnetic field. TbCo5 shows basal
EMD and the uni-axial distribution of the poles 00l has its maximum
perpendicular to the rotation symmetry axis, which lies in the magnetic field
direction. Complete Debye-Scherrer rings measured with an image plate
detector allowed to characterize fully the preferred orientation and to
decompose the overlapping reflections in the powder patterns. The decomposition
resulted in correct values of the structure amplitudes. The texture aided
powder pattern decomposition can be used also in the case of samples containing
more unknown phases, if they show sufficiently strong texture.
Acknowledgements
The
author want to thank to the staff of the Swiss-Norwegian Beamline (BM-1) at the
ESRF Grenoble for the help with diffraction experiment. This work was supported
by the Swiss National Science Foundation project no. 21-53847.98.
References
[1] M. Dahms & H.J. Bunge, Textures
and Microstructures 6 (1986),
167 – 179.
see also:
H.J. Bunge, M. Dahms & H.G.
Brokmeier, Cryst. Rev. 2 (1989), 67 – 88.
see also:
R. Hedel, H.J. Bunge & G. Reck, Textures and Microstructures 29 (1997), 103 – 126.
[2] T. Wessels, Ch. Baerlocher & L.B.
McCusker, J. Am. Chem. Soc. 121
(1999), 6242-6247.
[3] R. Cerny, Proc.
45th Annual Conf. on Applications of X-ray Analysis, (1996), Denver,
in Advances in X-ray Analysis,40 (1998) CD-ROM.
see also :
R. Cerny, Mat. Sci. Forum 321-324
(1999), 22-28.
[4] R. Cerny, V. Valvoda & M. Chládek, J.
Appl. Cryst. 28 (1995), 247 -
253.
[5] W.A. Dollase, J. Appl. Cryst. 19 (1986), 267 – 272.
[6] V.F. Sears, J. Appl. Cryst. 17 (1984), 226 – 230.
[7] J. Rodriguez-Carvajal. FULLPROF,
Ref. Guide, Lab. Leon Brillouin (CEA-CNRS), (1994)