[Previous]

Introduction


Definition

      Obesity is defined as an unhealthy amount of body fat (45) or, in other words, an excess of fat (triglycerides) storage in the adipose tissue (19).

      The most appropriate tool to quantify the degree of obesity is the Body Mass Index (BMI) or Quetelet Index. This index is calculated by dividing one's weight (in kg) by the square of one's height.

      BMI = mass (kg) / height² (square m)

      The reference values of BMI are identical for both sexes (table 1):

      
Tabl. 1 : Obesity classification using BMI values in adults
normal range 18.5 - 24.9 kg/m2
Overweight 25 - 29.9 kg/m2
Obesity class I 30 - 34.9 kg/m2
Obesity class II (severe) 35 - 39.9 kg/m2
Obesity class III, (morbid) > ; 40 kg/m2


Prevalence and incidence

      Obesity increased dramatically its prevalence the last 20 yeas (91, 72, 36). Obesity became a big health problem for the modern, developed countries. Great Britain obesity's prevalence doubled between 1980 and 1991 to reach nearly 20% of the population. Some other country averages are: USA - which detains the record - 25%; France, Sweden and Holland 7-10%.


Morbidity

      Morbidity is an important feature when we talk about obesity. If there is some debate if there is a health benefit of being thinner among the individuals whose BMI is less than 25, there is no doubt that a BMI over 25 confers increased health risk. Overweight and obesity have been associated with an increasing risk of a large number of disorders including, but not limited to the following :


Factors influencing the weight gain

      Both increasing prevalence and morbidity of obesity have multiple causes. Among the most important factors in the development and persistence of obesity we remind the following:

      Physical exercise limits the decrease in energy expenditure (EE) at rest, that appear with ageing and explain the weight gain in elder persons (46, 90).


Psychological factors

      The role of psychological factors in inducing obesity is controversial. Historically, prevailing opinions on the relationship between obesity and the psychological profile have varied greatly. In the 1960s and prior, the belief was hat obesity was, in part, caused by certain psychological abnormalities. At that point, most of the studies were based on limited samples of obese people seeking treatment (32). A study published by Stunkart and Mendelson (1967), caused the pendulum to swing in the other direction. By examining a less specific, wider sample of obese persons, it was concluded that the previous opinion might have been incorrect. The authors found that in a large, non-clinical community-based sample, there was no meaningful association between obesity and gross pathology. From the influence of Stunkard and those who followed in the 1970s and 1980s, it was generally thought that either there was no real correlation between obesity and psychological adjustment, the attendant social stigma caused psychological maladjustment and not the reverse. In the 1990s, a greater complexity is being acknowledged (36). There is accepted that there may be a complex interrelationship between psychological profile and obesity, but causal direction is unclear.

      Binge eating disorder (BED) - eating very fast a huge amount of food in response to psychological stimuli instead of hunger, followed by a feeling of culpability and poor self esteem - is viewed as the major psychological disorder of obese persons. It occurs in about 40% of the obese persons (80). Among those subjects BED is associated with increased adiposity and frequent, significant weight fluctuations (81, 29, 15). This explains the difficulty of maintaining the low weight levels achieved after treatment especially in BED patients.

      Compared with non-BED obese subjects, BED obese patients have lower self-esteem, poorer sense of personal effectiveness, more disturbed self-attitudes and higher levels of depression, anxiety and personality disturbances (89, 94).

      Even if we don't know the sense of the causal relationship between obesity and psychological disorders, we can notice that morbidly obese persons have a real psychological and somatic sufferance, which lowers considerably their quality of life.

      The psychological aspect is marked by different degrees of anxiety and depression. Both of them are significantly improved by the stable weight loss.


Treatment

      It have been demonstrated that even a small decrease in body weight, (i.e. of 5-10%), is associated with clinically important improvements in cholesterol levels, blood pressure, glycaemia and other health indices (40). These benefits persist if the weight loss is maintained (95). Those findings as well as the huge increasing in prevalence of obesity and its complications have justified substantial efforts in finding effective methods for loosing weight and maintaining stable low weight.

      a) Food restriction diets

      The food restriction was, historically, the first approach in treating obesity but, unfortunately, with poor long-term results. Diet, as unique treatment, induces or aggravates the eating disorders. The complications of dieting are: gaining more weight (by the means of reducing the metabolism at rest), increasing morbidity of obesity, inducing weight cycling and diminishing the psychological status of the patient. As an example, all the studies that followed patients for 5 years or more after a successful food restriction diet - which means loosing at least 10% of their initial body weight - showed that almost all the patients have reached or exceeded their initial body weight after 5 years (54, 96, 19 etc.). This is why, at present, the food restriction alone it is no longer recommended as treatment of obesity.

      b) Cognitive- behavioural approach

      Association of cognitive-behavioural approach to the food restriction or to a regular, healthy, diet was thought to be the solution in treating obesity. Unfortunately this was not the case. Excepting the improvement in the eating behaviour and anxio-depressive disorders, the weight loss was disappointing (69).

      c) Drug treatment

      Drugs alone or in association with previous types or therapies gave place to big expectations. There are a few classes of drugs used in the treatment of obesity :

      Unfortunately none of those substances can give a solution to the big problem that is obesity either because of the induced risks, or of their inefficacy.

      d) Surgical treatment of obesity, so-called - bariatric surgery

      Because current treatments, as we have seen, are usually ineffective in patients with morbid obesity, surgical methods (especially Roux-en-Y gastric by-pass) have been assessed. The success rate in achieving and maintaining long term weight loss is 80% or greater, significantly higher than with any other treatment (16).

      Results of bariatric surgery

      What do we expect from surgical methods of loosing weight - called bariatric surgery - in terms of results? Patients lose after the gastric bypass, around 50-60% of their excess body weight in the first year and they can generally maintain the weight loss at 5 years with only a modest regain of 5-7 kg (18, 64, 8). These long term results makes the bariatric surgery the only way of loosing weight and maintaining weight lost for the morbidly obese persons.

      Classification of the bariatric procedures :

  1. Gastric Bypass (GBP), the most used is the Roux en Y GBP technique (see description below)
  2. Horizontal Gastroplasty
  3. Vertical Gastroplasty
  4. Gastric Banding
  5. Biliopancreatic Diversion
  6. Jejunoileal Bypass

      1. Gastric Bypass (GBP)

      The gastric bypass (GBP) is considered by many to be the gold standard of the bariatric surgery.

      Historical data on GBP

      The GBP has been practised on humans since 1967 and has undergone many modifications ever since. The prototype was Billroth II gastric operation but without removal of the distal stomach.
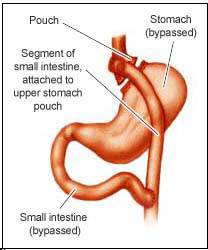
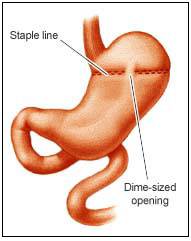
      GBP description

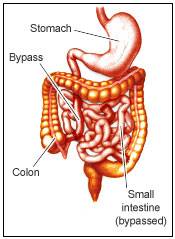
      The GBP consists in creating a small pouch of 30cc from the upper stomach by stapling and therefore, separating the stomach in two separate compartments. The 30cc stomach pouch is drained into an intestinal loop (Roux en Y loop, most frequently) made by the small bowel (fig. 1). To bring the bile and the pancreatic secretion for the normal digestion, another surgical anastomosis is practiced between two loops of the small bowel at various distances from the ileo-caecal valvulae, for ex: 50-60cm for distal Roux en Y GBP.


Fig. 1 : Horizontal Roux en Y Gastric Bypass

      The mechanism of GBP functioning

      GBP causes weight loss - by diminishing caloric intake - through multiple mechanisms :

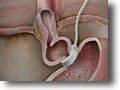
      2. 3. 4. Horizontal Gastroplasty, Vertical Gastroplasty and Gastric Banding

      Those are techniques by which the stomach is divided in two pouches that communicate one to another (fig. 2 and 3). The only mechanism of loosing weight, in this case, is the mechanical restriction of the quantity of food intake. That's why the long-term results are poorer than with the GBP.


Fig. 2 : Gastric stapeling

Inconvenients of the gastroplasties (gastric stapeling)

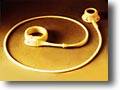
Inconvenients of the gastric binding (fig. 3)

      
Fig. 3 : adjustable gastric banding

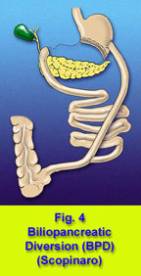
      5. Biliopancreatic diversion (BPD)

      Developed by Scopinaro in Genoa, has some similarities to the distal Roux en Y distal GBP (fig. 6), but a subtotal gastrectomy is performed and a gastric pouch of 200cc to 400cc is left. There is a wide stoma between the gastric poach and the gut to permit adequate meals and avoid the major sequelae, hypoalbuminemia, which occurred in about 10% of patients (Scopinaro N, Probl. Gen. Surg. 9:298).


Fig. 4 : Scopinaro's BPD

      Inconvenients of BPD

      6. Jejunoileal Bypass (JI)

      Performed at large scale in the '60s-'70s JI (fig. 5) has been abandoned because of the high incidence of the complications.


Fig. 5 : Jejunoileal Bypass

      Complications of JI

      Considering all previous data and the complex profile of the morbidly obese individual, those patients should be selected and clinically followed by a multidisciplinary team. This team consists in: physicians with special interest in obesity, dieteticians, psychologists or psychiatrists interested in behaviour modification and eating disorders and a surgeon with experience in bariatric procedures.


Hypothesis

      We clinically observed that the most obese of our patients have more difficulties to correct their BMI after the GBP. Our hypothesis is that those patients might be psychologically different from the less obese individuals of our group (BMI < 44 kg/m2) and this difference might play a role in loosing weight after the GBP.

      The purpose of our study is to determine the relationships or even the correlations, between the pre-surgery psychological profile of morbidly obese subjects and the post-surgery outcome, in terms of loosing weight.


Question

      What it would be interesting to know, but there is no available coherent data, is :

  1. Who will be the best subject for the bariatric surgery? In other words: is it possible, using the pre-surgery data only, to predict who will lose a satisfactory amount of weight without any psychological complications (suicide, alcoholism, worsen BED etc.)?
  2. Is there a method to improve the weight loss after the GBP? If yes, which subgroup of patients would benefit the most?

Subjects and methods


Study subjects

      Our subjects were 80 morbidly obese patients. They underwent bariatric surgery (Roux en Y gastric by-pass) at the Geneva University Hospital, as treatment for obesity. The protocol of this study received the approval of the Ethical Committee of the Department of Surgery of the Geneva University Hospital.

      A multidisciplinary medical team involving internists, surgeons, psychiatrists, dieteticians and psychologists, examined the candidates for the bariatric surgery. No one of the candidates was rejected.

      The group was composed of 68 women (85%) and 12 men (15%) :


      The averagepreoperative BMI was 45.3, range 33.2 - 88.3; the average age was 37.6 years, range 21 - 64 years; the average weight was 122.8 kg, range 90 - 226 kg; the average height was 1.64m, range 1.46 - 1.91 m (Tabl. 2).

      
Tabl. 2 : physical characteristics of our 80 patients group of obese patients before the bypass
Pre-surgery parameter Mean +/- sem Range
BMI (kg/m2) 45.3 +/- 0.85 33.2 - 88.3
Age (years) 37.6 +/- 1.01 21 - 64
Weight (kg) 122.8 +/- 2.51 90 - 226
Height (m) 1.64 +/- 0.01 1.46 - 1.91


Inclusion Criteria

      All entrants into the study were required to meet certain criteria before surgery:

  • BMI > 40 if no co-existing morbidity,
  • BMI >35 if either one of the following morbidities is present: HTA, diabetes mellitus, arthrosis, sleep apnoea etc.
  • acceptable surgical risks,
  • capability of understanding the surgery, its consequences and to give an informed consent.

Exclusion Criteria

      As part of the pre-surgery protocol, a psychiatrist evaluated all patients. Psychiatric pathology, history of substance abuse or suicidal ideation was exclusion criteria in our study. At that moment there was no person excluded from the GBP therapy because one of those criteria in our study.


Methods


Study Design

      In order to establish weather the pre-surgery psychological profile influences the outcome of the gastric bypass in our 80 obese patients, they were asked to fill in a battery of psychological tests prior to surgery :

  • Beck Depression Inventory
  • Hospital Anxiety and Depression Scale
  • Rathus test
  • Nottingham Health Profile
  • Eating Disorder Inventory.

      The non-psychological parameters used in our study are :

  • body weight (BW), height, body mass index (BMI)
  • the BW was determined before surgery and at one year after surgery.

      The aim of the study was to establish the correlation, if any, between the pre-surgery psychological profile and the post-surgery evolution of the BW.


Intervention

      All our patients underwent the Roux en Y gastric bypass - as described in the Introduction - as a treatment of morbid obesity. The surgical technique of the GBP is highly standardised in our hospital, so all our patients underwent exactly the same surgery. The day of the surgery was considered the time zero of our study.


Methods of measurement

      a) The psychological profile was determined by means of the following 5 tests :

      1. Eating Disorder Inventory II (37)

      This test was designed to quantify a certain number of psychological and behavioural traits common to eating disorders as anorexia nervosa and bulimia. It is composed of 64 questions grouped into 8 subgroups.

  • Drive for thinness - indicates the excessive concern with dieting, preoccupation with weight and extreme pursuit of thinness
  • Bulimia - indicates the tendency toward episodes of uncontrollable overeating (bingeing) and may be followed by self-induced vomiting.
  • Body dissatisfaction - reflects the belief that specific parts of the body are too large.
  • Ineffectiveness - assesses feeling of general inadequacy, insecurity, worthlessness and the feeling of not controlling their lives.
  • Perfectionism - indicates excessive personal expectations.
  • Interpersonal distrust - reflects a sense of alienation and general reluctance to form close relationships.
  • Interoceptive awareness - reflects one's lack of confidence in recognising and accurately identifying emotions or visceral sensations of hunger or satiety.
  • Maturity fears - measures one's wish to retreat to the security of the pre-adolescent years because of the overwhelming demands of adulthood.
  • Ascetism - reflects the avoidance of sexual relationships.
  • Impulse regulation - shows the difficulty in regulating impulses, especially the binge behaviour.
  • Social insecurity - estimates social fears and insecurity.

      
Tabl. 3 : Eating Disorder Inventory ranges.
Category Normal range Eating disorder range
Drive for thinness 3 - 7 12 - 16
Bulimia 1 - 2 9 - 13
Body dissatisfaction 9 - 15 13 - 19
Ineffectiveness 1 - 4 9 - 14
Perfectionism 4 - 9 7 - 11
Interpersonal distrust 1 - 3 4 - 8
Interoceptive awareness 1 - 5 8 - 14
Maturity fears 2 - 4 4 - 6
Asceticism 2 - 5 5 - 11
Impulse regulation 1 - 4 4 - 8
Social insecurity 2 - 5 6 - 9

      2. Hospital Anxiety and Depression Scale (96), which gives a score of anxiety and depression (Tabl. 4).

      
Tabl. 4 : meaning of Hospital Anxiety and Depression scores.
Range Meaning
< ; 7 No anxiety or depression
8 to 10 Border line anxiety or depression
> ; 11 Marked anxiety or depression

      3. Beck Depression Inventory (6,7), measures the intensity of the depression.

      
Tabl. 5 : meaning of Beck Depression Inventory scores.
Range Meaning
< ; 8 No depression
8 to 18 Mild depression
18 to 29 Moderate depression
> ; 30 Marked depression

      For both HAD and BDI we choose as cut off value in our study the superior limit of the normal range. Our choice is justified by the difficulty to compare degrees of anxiety or depression that have not been standardised.

      4. Nottingham Health Profile (50), which is a standardised tool for the survey of general health problems. The more affected the patient is, the higher score he/she gets.

      5. Rathus test (20), gives a score that that represents the quantification of patient's self esteem.

      
Tabl. 6 : meaning of Rathus test scores.
Range Meaning
< ; 90 Tendency to aggressiveness
90 - 100 Normal
> ; 125 Low self esteem

  1. The BW measurements were performed after an overnight fast.

Analysis of data

      The parameters were summarised as average +/- standard error of the mean (sem).

      Statistical analysis was simple or multiple regression analysis (StatView 4.5; Abacus Concepts Inc. Berkeley, CA). We considered a P value significant when P < 0.05.

      Analysis of variance (ANOVA) was used to compare the means of different psychological parameters among the groups (either two groups or four groups).

      Bonferroni's correction was originally designed in the field of analysis of variance to take into account multiple sub group comparison, only when the overall model has been shown to be statistically significant. The correction imply to divide the usual p threshold set at 0.05 by the number of groups to compare. Thus, when one perform multiple comparison with 4 subgroups, the new p threshold becomes, here either 0.05/2=0.025 or 0.05/4=.0125. The need for this correction is controversial and disputed in the literature. (see 97: Thomas V Perneger What's wrong with Bonferroni adjustments BMJ 1998;316:1236-1238) 'This paper advances the view, widely held by epidemiologists, that Bonferroni adjustments are, at best, unnecessary and, at worst, deleterious to sound statistical inference.'

      By providing exact p value, we let the reader choose whether he want to apply the Bonferroni's adjustment or not.

      Regression models were performed to analysethe association between different psychological parameters assessed as continuous scores (independent variables, Xi) and the percentage of BMI variation after one year of follow-up (dependent variable, Y). The strength of this association was quantified by r-squared, which express the amount of variability of Y explained by X.

      We divided our group in subgroups by two criteria :

  • Age - cut off point 35 years
  • BW - cut off point BMI 44 = 75% excess body weight (BW)

      Even if age and BW are continuous variables, we choose to split our group in subgroups because, according to our study hypothesis, different subgroups might react differently after the GBP.

      The choice of the cut off points was made according to previous publications of our group (20). The original explanation of the cut off points was that, for all the patients that underwent GBP in our hospital, the median for age was 35 years and the median for weight was BMI 44 which means 75% excess BW or 120kg in the above mentioned article.


Results

      We found the following psychological profile in our patients comparing to normal subjects (Tabl. 1) :

      
Tabl. 1 : Pre-surgery psychological profile in BW and age groups
  Mean +/- sem (pre-surgery values)
Psychological test Normal range < ;75% exc. BW > ;75% exc. BW Age < ;35 years Age > ;35 years All patients
HAD anxiety score < ;7 7.8
±0.6
8.4
±0.6
8.3
±0.6
8
±0.6
8.1
±0.4
HAD depression score < ;7 5.7
±0.6
5.4
±0.5
5.5
±0.6
5.6
±0.5
5.6
±0.4
BDI < ;8 13.7
±1.7
14.6
±1.3
15.5
±1.7
13
±1.3
14.2
±1
RATH 90 - 100 96.1
±3
99
±3
95.6
±3.8
99.3
±2.2
97.6
±2.1
NHP 0 10.7
±1.2
12.6
±1
11.5
±1.1
11.8
±1.1
11.7
±0.7
sEDI2 27 - 63 66.4
±5.2
65.3
±3.6
70.3
±5.3
62
±3.6
65.9
±3.1
Number of patients 39 41 37 43 80

      No significant difference between those groups

      There were no significant differences in the pre-surgery psychological profile between the following groups:

      The % BMI correction = (actual BMI - normal BMI)*100 / (pre-surgery BMI - normal BMI)

      The normal BMI in the above formula was considered the BMI = 25kg/square meter which is the superior value of the normal range.

      The % of BMI correction at 1 year after GBP had the following characteristics (Tabl. 2) :

      
Tabl. 2 : Weight loss at 1 year after GBP
  Mean +/- sem (values 1 year after surgery)
Weight loss at 1 year < ;75% exc. BW > ;75% exc. BW Age < ;35 years Age > ;35 years All patients
In kg 36.3
±1.53
40.4
±2.1
43.4
±4.9
34
±1.2
38.1
±1.3
BMI correction 84.7%#
±3.4
65.9%
±4.2
81.2%
±4.5
72.8%
±3.9
76.5%
±3
Number of patients 23 18 18 23 41
# p< ;0.001 between < ;75% and > ;75% excess BW groups

      High scores of depression in the HAD-D test were significantly correlated with a higher body weight correction after one year in our entire group (p<0.04) (Tabl. 3).

      The degree of anxiety influenced the BW correction after 1 year. The influence was depending on the BW excess at pre-surgery time point. We found a positive correlation in < 75% excess BW group (< 44 BMI) and a negative correlation in the >75% excess BW group (> 44 BMI).

      
Tabl. 3 : Prediction of BMI correction at 1 year with pre-surgery psychological tests, in BW and age groups
  P values for regression analysis of : % of BMI correction at 1y vs. psychological tests
Psychological test < ;75% exc. BW > ;75% exc. BW Age < ;35 years Age > ;35 years All patients
HAD-A 0.0147 0.0152* 0.109 0.450 0.490
HAD-D 0.0026 0.550 0.322 0.023 0.032
BDI 0.0044 0.071 0.795 0.134 0.161
RATH 0.439 0.024* 0.200 0.658 0.293
NHP 0.0003 0.015* 0.410 0.159 0.521
sEDI2 0.0623 0.383 0.542 0.329 0.190
Number of patients 23 18 18 23 41
* negative correlation

      Globally, the impact of pre-surgery psychological profile on BMI correction after 1 year was as follows (Tabl. 3) :

      The age had no influence on the relationship between psychological tests and the BMI correction at 1 year (Tabl. 3).

      
Tabl. 4A : Pre-surgery EDI2 categories in BW and age groups
  Mean +/- sem (pre-surgery values)
EDI2 Normal range < ;75% exc. BW > ;75% exc. BW Age < ; 35 years Age > ; 35 years All patients
Drive for thinness 3 - 7 7.9
±0.7
7.7
±0.7
7.32
±0.62
8.2
±0.7
7.8
±0.5
Bulimia 1 - 2 3.4
±0.7
3.1
±0.6
3.9
±0.8
2.7
±0.4
3.2
±0.4
Body dissatisfaction 9 - 15 21.9
±0.9
22.9
±0.8
22.5
±1
22.4
±0.8
22.4
±0.6
Ineffectiveness 1 - 4 5.2
±1
4
±0.6
5.8
±1.1
3.6
±0.6
4.6
±0.6
Perfectionism 4 - 9 3.8
±0.6
4.7
±0.6
3.9
±0.7
4.6
±0.5
4.3
±0.4
Interpersonal distrust 1 - 3 3
±0.5
3.4
±0.6
3.9
±0.6
2.7
±0.5
3.2
±0.4
Interoceptive awareness 1 - 5 5.2
±0.8
4.7
±0.7
5.4
±0.9
4.5
±0.7
4.9
±0.5
Maturity fears 2 - 4 3.7
±0.6
3.4
±0.5
3.8
±0.7
3.3
±0.4
3.5
±0.4
Asceticism 2 - 5 5.6
±0.6
4.9
±0.5
5.7
±0.7
4.8
±0.4
5.2
±0.4
Impulse regulation 1 - 4 3
±0.6
2.8
±0.45
3.8#
±0.6
2.1
±0.4
2.9
±0.4
Social insecurity 2 - 5 3.7
±0.6
3.8
±0.5
4.2
±0.7
3.4
±0.5
3.8
±0.4
Number of patients 39 41 37 43 80
# p< ; 0.03 between < ;35years and > ;35years group

      The Impulse regulation scores were significantly influenced by age. For the younger group the score is 80% higher than in the older group (Fig. 1 and Tabl. 4A). Even if both values are in the normal range, there is a statistically significant (p<0.03) trend in the younger group to have higher scores; meaning that the <35 years patients had more difficulty to regulate their binge eating behaviour than the >35 years patients. Concerning all the other categories of the EDI2 test, there was no difference by age, or by BW excess (Tabl. 4A).

      Note : The above statements disregard an eventually misreport correlated with the same age groups.


Fig. 1 : Impulse regulation and age

      There was no significant correlation between EDI2 categories and BMI correction at 1 y in our subgroups (Table 4B), excepting in >75% excess BW group (less than 44 BMI). In this group we found a negative correlation (p<0.03) between Impulse regulation score and BW correction at 1y.

      
Tabl. 4B : Prediction of BMI correction at 1 year with pre-surgery EDI2 categories
  P and R² values for regression analysis : % of BMI correction at 1y vs. EDI test
EDI2   < ;75% excess BW > ;75% excess BW Age < ;35 years Age > ;35 years
Drive for thinness P 0.140 0.301 0.146 0.747
0.099 0.067 0.128 0.005
Bulimia P 0.273 0.524 0.586 0.697
0.056 0.026 0.018 0.007
Body dissatisfaction P 0.069 0.123 0.219 0.198
0.149 0.143 0.092 0.078
Ineffectiveness P 0.102 0.364 0.282 0.881
R² 0.125 0.051 0.073 0.001
Perfectionism P 0.983 0.806 0.924 0.583
R² 0.0001 0.004 0.001 0.015
Interpersonal distrust P 0.639 0.197 0.451 0.519
R² 0.010 0.102 0.036 0.019
Interoceptive awareness P 0.340 0.981 0.280 0.722
R² 0.043 0.000 0.072 0.006
Maturity fears P 0.484 0.279 0.422 0.662
R² 0.023 0.073 0.041 0.009
Asceticism P 0.321 0.412 0.337 0.622
R² 0.048 0.042 0.058 0.012
Impulse regulation P 0.190 0.025* 0.479 0.746
R² 0.080 0.277 0.032 0.005
Social insecurity P 0.223 0.875 0.622 0.177
R² 0.070 0.002 00.016 0.085
Number of patients 23 18 18 23
* negative correlation

      We also divided our group in combined subgroups, by age and % of excess BW as follows :

      in order to detect further implication of the age and BW on the weight loss at one year.

      The pre-surgery psychological profile of those groups we found the following significant differences (Tabl. 5A).

      
Tabl. 5A : Pre-surgery psychological profile in combined BW and age groups
  Mean +/- sem (pre-surgery values)
Age < ;35 years Age > ;35 years
Psychologicaltest Normal range < ;75% excess BW > ;75% excess BW < ;75% excess BW > ;75% excess BW
HAD-A < ;7 8.5
± 0.837
8.1
± 0.836
7.3
± 0.775
8.7
± 0.773
HAD-D < ;7 6.1
± 0.903
4.8
± 0.896
5.4
± 0.850
5.8
± 0.63
BDI < ;8 17.3#
± 2.683
13.7
± 2.069
10.6
± 1.992
15.4
± 1.549
RATH 90 - 100 96.2
± 5.514
94.9
± 5.427
96
± 3.163
102.5
± 2.891
NHP 0 12.6
± 1.617
10.5
± 1.413
9.1+
± 1.746
14.3
±1.239
sEDI2 27 - 63 77.7##
± 9.256
63.2
± 5.092
56.8
± 4.912
67.1
± 5.073
Number of patients 18 19 21 22
# p< ; 0.03 between < ;35 years and > ; 35 years, in the < ;75% excess BW
## p< ; 0.02 between < ;35 years and > ; 35 years, in the < ;75% excess BW
+ p< ; 0.02 between < ;75% and > ;75% excess BW, in the > ;35 years group

      1. depression score (BDI) was 63% higher in <35 years than in >35 years in the <75% excess BW group (BMI < 44), (p<0.03). So younger subjects had a significantly higher score of depression than older subjects.

      2. quality of life score (NHP) was 57% higher - showing a poorer quality of life - in >75% excess BW (BMI > 44),than in <75% excess BW (BMI < 44), in the >35 years group (p<0.02). So the older the patient is, the poorer the quality of life he/she had (Figure 2).


Fig. 2 : Quality of life (NHP)

      A = <35 years < 75% exc.BW group, B = <35 years > 75% exc.BW group, C = >35 years < 75% exc.BW group, D = >35 years > 75% exc.BW group.

      3. eating disorder summary score (sEDI2) was 37% higher in <35 years than in >35 years in the <75% excess BW group (BMI < 44), (p<0.02). So younger subjects had a significantly higher eating disorder summary score than older subjects, meaning that eating disorders are more important in young people (Figure 3)


Fig. 3 : Eating disorders (sEDI2) in combined groups

      A = <35 years < 75% exc.BW group, B = <35 years > 75% exc.BW group, C = >35 years < 75% exc.BW group, D = >35 years > 75% exc.BW group.

      In the mixed (age and BW excess) groups the pre-surgery psychological profile had a significant correlation with the BMI correction after 1 year as follows :

      
Tabl. 5B : Prediction of BW correction at 1 year with pre-surgery psychological tests in combined BW and age groups
  P values for regression analysis of : % of BMI correction at 1y vs. psychological tests
Age < ;35 years Age > ;35 years
Psychological test < ;75% excess BW > ;75% excess BW < ;75% excess BW > ;75% excess BW
HAD-A 0.311 0.014* 0.061 0.508
HAD-D 0.065 0.805 0.024 0.753
BDI 0.070 0.169 0.059 0.990
RATH 0.366 0.041* 0.519 0.961
NHP 0.151 0.022* 0.005 0.895
sEDI2
0.245 0.218 0.210 0.492
Number of patients 11 7 12 10
*negative correlation

      When we analysed the EDI2 categories in mixed (age and excess BW) groups (Table 6A), we found some interesting facts :

      
Tabl. 6A : Pre-surgery EDI2 categories in combined BW and age groups
  Mean +/- sem (pre-surgery values)
Age < ;35 years Age > ;35 years
EDI2 Normal range < ;75% excess BW > ;75% excess BW < ;75% excess BW > ;75% excess BW
Drive for thinness 3 - 7 7.7
±0.9
7
±0.9
8
±1.1
8.3
±1
Bulimia 1 - 2 4.8#
±1.2
3
±1
2.1
±0.6
3.2
±0.7
Body dissatisfaction 9 - 15 22.3
±1.4
22.7
±1.5
21.7
±1.3
23
±0.9
Ineffectiveness 1 - 4 8.2##
±2
3.5x
±0.8
2.6
±0.6
4.5++
±1
Perfectionism 4 - 9 3.2
±1.1
4.6
±1
4.4
±0.7
4.7
±0.7
Interpersonal distrust 1 - 3 3.7
±0.8
4
±0.9
2.4
±0.6
3
±0.7
Interoceptive awareness 1 - 5 6.8
±1.5
4.2
±1
3.8
±0.8
5.2
±1.1
Maturity fears 2 - 4 4.9
±1.1
2.8
±0.7
2.7
±0.5
3.8
±0.8
Asceticism 2 - 5 6.8#
±1.1
4.7
±0.8
4.5
±0.6
5
±0.7
Impulse regulation 1 - 4 4.8##
±1.1
2.8
±0.6
1.4
±0.4
2.7+
±0.7
Social insecurity 2 - 5 4.6
±1.1
3.8
±0.8
3
±0.7
3.7
±0.6
No of patients 18 19 21 22
# p< ; 0.05 between < ;35 years and > ; 35 years, in the < ;75% excess BW group
##p< ; 0.002 between < ;35 years and > ; 35 years, in the < ;75% excess BW group
x p< ; 0.008 between < ;75% and > ;75% excess BW, in the < ;35 years group
++ p< ; 0.03 between < ;35years < ;75% excess BW group and > ;35years > ;75% excess BW group
+ p< ; 0.05 between < ;35years < ;75% excess BW group and > ;35years > ;75% excess BW group


Fig. 4 : Bulimia in combined groups

      A = <35 years < 75% exc.BW group, B = <35 years > 75% exc.BW group, C = >35 years < 75% exc.BW group, D = >35 years > 75% exc.BW group


Fig. 5 : Ineffectiveness in combined groups


Fig. 6 : Impulse regulation in combined groups

      A = <35 years < 75% exc.BW group, B = <35 years > 75% exc.BW group, C = >35 years < 75% exc.BW group, D = >35 years > 75% exc.BW group

      
Tabl. 6B : Prediction of BW correction at 1 year with pre-surgery EDI categories in combined BW and age groups
  P and R² values for regression analysis of:
% of BMI correction at 1y vs. EDI test
Age < ;35 years Age > ;35 years
EDI2   < ;75% excess BW > ;75% excess BW < ;75% excess BW > ;75% excess BW
Drive for thinness P 0.086 0.501 0.493 0.641
R² 0.280 0.095 0.047 0.026
Bulimia P 0.751 0.703 0.2965 0.716
R² 0.011 0.032 0.106 0.015
Body dissatisfaction P 0.854 0.044* 0.073 0.819
R² 0.004 0.589 0.287 0.006
Ineffectiveness P 0.219 0.039* 0.240 0.989
R² 0.165 0.606 0.134 0.000
Perfectionism P 0.583 0.691 0.725 0.033
R² 0.036 0.035 0.012 0.412
Interpersonal distrust P 0.293 0.781 0.807 0.093
R² 0.121 0.017 0.006 0.282
Interoceptive awareness P 0.490 0.823 0.678 0.507
R² 0.053 0.011 0.017 0.051
Maturity fears P 0.232 0.330 0.137 0.938
R² 0.156 0.188 0.206 0.001
Asceticism P 0.510 0.746 0.625 0.394
R² 0.051 0.022 0.025 0.080
Impulse regulation P 0.499 0.011* 0.307 0.892
R² 0.052 0.759 0.101 0.002
Social insecurity P 0.283 0.531 0.458 0.270
R² 0.127 0.088 0.055 0.135
Number of patients 11 7 12 11
*negative correlation

      The EDI2 categories were significantly correlated with the BMI correction after 1 year as follows (Tabl. 6B) :

      In combined age and excess BW groups the analysis of the BW loss after one year showed that (Tabl. 7) :

      
Tabl. 7 : Weight loss after 1 year in combined BW and age groups
  Mean +/- sem (values 1 year after surgery)
Age < ;35 years Age > ;35 years
Weight lost < ;75% excess BW > ;75% excess BW < ;75% excess BW > ;75% excess BW
In kg 39.9
±2.3
48.9xx
± 1.9
33.1
± 1.6
34.9
± 1.9
% of BMI correction 87.5
±3.5
71.3
±9.4
82.2#
±5.6
62.4
±3.5
Nnumber of patients 11 7 12 10
xx p< ; 0.002 between < ;35years > ;75% excess BW group and > ;35years > ;75% excess BW group
#p< ;0.009 between < ;75% and > ;75% excess BW, in the > ;35 years group

      We verified the correlations between sEDI2 and all the other psychological tests we used. We found a very strong correlation (p<0.0001) for all of them.


Discussion

      In our group the BW loss after one year was slightly higher than the one reported in the literature : 76.5% BMI correction one year after the bypass (i.e.76.5% loss of the excess BMI) compared to 50-60% correction in the literature (4, 8, 18, 64). We speculate that the difference arises from the different follow-up periods considered: one year in our study, between one and two years in the literature. More specifically, we know that after the first year there can be a weight regain of 7-9kg (4) that corresponds to the difference between our results and the literature.

      The pre-surgery psychological profile of our patients was sensibly equivalent with the same population sample in the literature in terms of :


Correlation between pre-surgery depression and BW correction at one year

      Our finding that pre-surgery depression is positively correlated with the weight loss after the GBP - is a new element. Anyhow previous studies (43, 87) showed that depression, even in the severe stage, did not diminish the weight loss after GBP.

      Our hypothesis that some subgroups of our main group might loose weight differently after the GBP, in relation to their pre-surgery psychological profile - was confirmed. Weight was determining in this relationship. Age did not play a role.

      For the most obese of our patients, anxiety, depression and the poor quality of life influenced negatively the weight loss after the GBP. This was not the case for the less obese of our group (BMI < 44). The choice of our cut off in separating the groups - as described in the Methods - can be criticize, but the results we found on the psychological field correspond with the biological differences found when studying the same subgroups (12), meaning that those groups are different and the pre-surgery BMI induce the difference.

      The patients included in our study with a BMI between 35 and 40kg/square meter, by definition had additional pathology related/induced by obesity. The patients over BMI 40kg/square meter have almost all the time obesity related pathology which means that our group was quite homogeny. So we had a selection bias in our study imposed by the bypass selection criteria that made difficult to assign the pre-surgery differences in the psychological profile we found - comparing to the normal range - to obesity itself or to the polypathology related to it. Further studies are needed examining subgroups with and without associated pathology in order to answer the above question.

      We stress upon the fact that there is no difference in the pre-surgery psychological profile between our two weight groups (35 to 44 kg/square m and more than 44), the only difference is their way to react - in terms of loosing weight - to psychopathology.

      We can speculate that pre-surgical BW changes the impact of the pre-surgical psychological profile on the BW correction after the GBP. We do not now the mechanism. Further studies would be needed.


Strengths of our study


Weakness of our study


Recommendations

      Taking into account the above results we can speculate that very obese patients (BMI>44) would beneficiate from a psychological therapy BEFORE surgery, in order to diminish the degree of anxiety and depression, and to improve the self-esteem. This intervention might improve their BW correction at one year after the GBP.


[Previous] [Next]