Characterize.
Is a circulation of images necessarily epidemic?
Béatrice Joyeux-Prunel & Nicola Carboni
How do we know if the circulation of a specific image is contagious, or if it is a completely different phenomenon?
Facing such a question is not the most pleasant. Our a priori answer will be that an image is contagious when it circulates a lot, certainly, but especially when this image is adopted by a new person after this person has been confronted with the image in question: the same image is reproduced to be published, reproduced again, or imitated, caricatured, etc.
Some images, however frequent in our periodicals, are clearly not contagious. A basic example: a logo, or a specific advertisement, whose reproduction depends strictly on its owner. Even if the image in question can be printed on various supports and on multiple occasions, its diffusion is the result of the initiative of the brand owner of the logo; not of the phenomena of resumption, copy, imitation or counterfeiting.
--
Example of a group of non-viral images.
--
A phenomenon is contagious when the adoption or contamination of a person depends on the number of other people affected. It is up to us, therefore, to examine whether the circulation of certain images, of certain motives, is contagious - the result of influences - or whether it is the result of other factors that we would have to isolate.
The decision that an image is viral or not depends on various points of view that the analysis allows to refine, to confirm or to invalidate as one multiplies the methods of approach. In general, we suspect that an image is viral because of two or three simple elements:
1/ it appears in several countries and therefore rises higher than others in the results brought by the Explore platform
2/ there is nothing to confirm that the diffusion of this image is the result of the decisions of a single authority;
3/ we suspect, just by intuition and what we could call "common sense", that the circulation of this image, this motif or this type of image has been linked to fashion, imitation or confrontation phenomena.
It is by pursuing the analysis, at multiple scales, that these hypotheses are then confirmed, invalidated - or complicated.
Macro scale, the great number.
Let us take as an example the diffusion of busts.
The macroscopic methods of epidemiology have revealed statistical regularities in the evolution of epidemic phenomena. They can be useful to us.
When a phenomenon seems to be contagious and it is possible to trace it (here such a symptom = 1 case; here such an image = 1 case), epidemiologists draw a frequency curve of the case, in order to observe how the epidemic phenomenon progresses over time.
Let's take an example, that of the busts, whose analysis we have already begun here. The aim is to observe the appearance and disappearance of busts, busts in images (photographs of busts in the international illustrated press of the beginning of the 20th century), or in originals (sculpted three-dimensional portraits), in the material and visual culture of the 20th century.
In our illustrated periodicals, our algorithms have isolated a significant number of photographs of busts whose frequency curve can be quite easily constructed -- here, in a relative manner (annual number of photographs of busts divided by the total annual number of images in the corpus) in order to avoid the overrepresentation of certain years whose sources would have been more available.
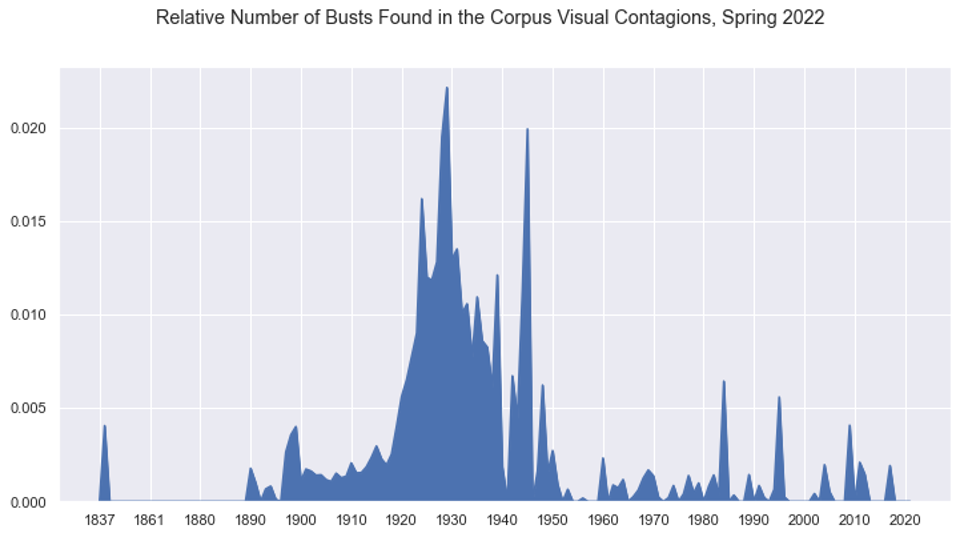
--
Relative annual frequency of photographs of busts in the illustrated press of the Visual Contagions project - sample of about 120,000 periodicals, approx. 3 million images in total, from an international but mostly European corpus. Extraction made in spring 2022.
At a glance: three typical shapes identified by epidemiology, to which sections of the curve seem to correspond quite well.
Frequency and shape of the curve
According to epidemiology, the shape of the frequency curve of an epidemic can give indications of how the contagion may have been transmitted. On the graph above, we have plotted three types of epidemiologically identified forms on the frequency curve. Each of the possible forms is placed above a segment of the curve that corresponds to it.
One-off epidemics
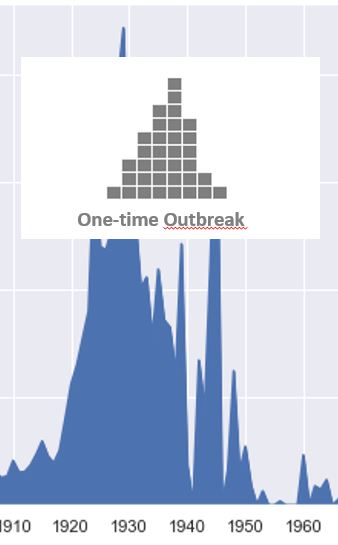
In the case of one-off epidemics, the epidemic curve is characterized by a single peak. The "infected cases" have been exposed to a common source for a short period of time, for example at a concert, a family dinner or a political meeting. The number of infections rises rapidly to a peak and then gradually declines.
This seems to be the case with our busts in the 1920s: illustrated magazines reproduce photographs of busts more often, as well as in the 1940s. We seem to be dealing with a fashion.
What are the possible causes of this fashion? The shape of the curve does not indicate this; on the other hand, it prompts us to reflect on the mode of diffusion of the contagion. One-off epidemics are triggered by a central event, where the virus takes hold and affects more people.
Multiplying the approaches and sources allows us to go further
How can we verify, for example, the event hypothesis? We can do it with our database of exhibition catalogs, the one of the Artl@ project, where it is possible to simply visualize in a curve the frequency of artworks containing in their title the radical "bust". A very simple request, a very simple answer - a very simple way to reinforce the hypothesis: here too we see a strong increase in the number of works containing the word "bust" in the exhibitions of the 1920s.
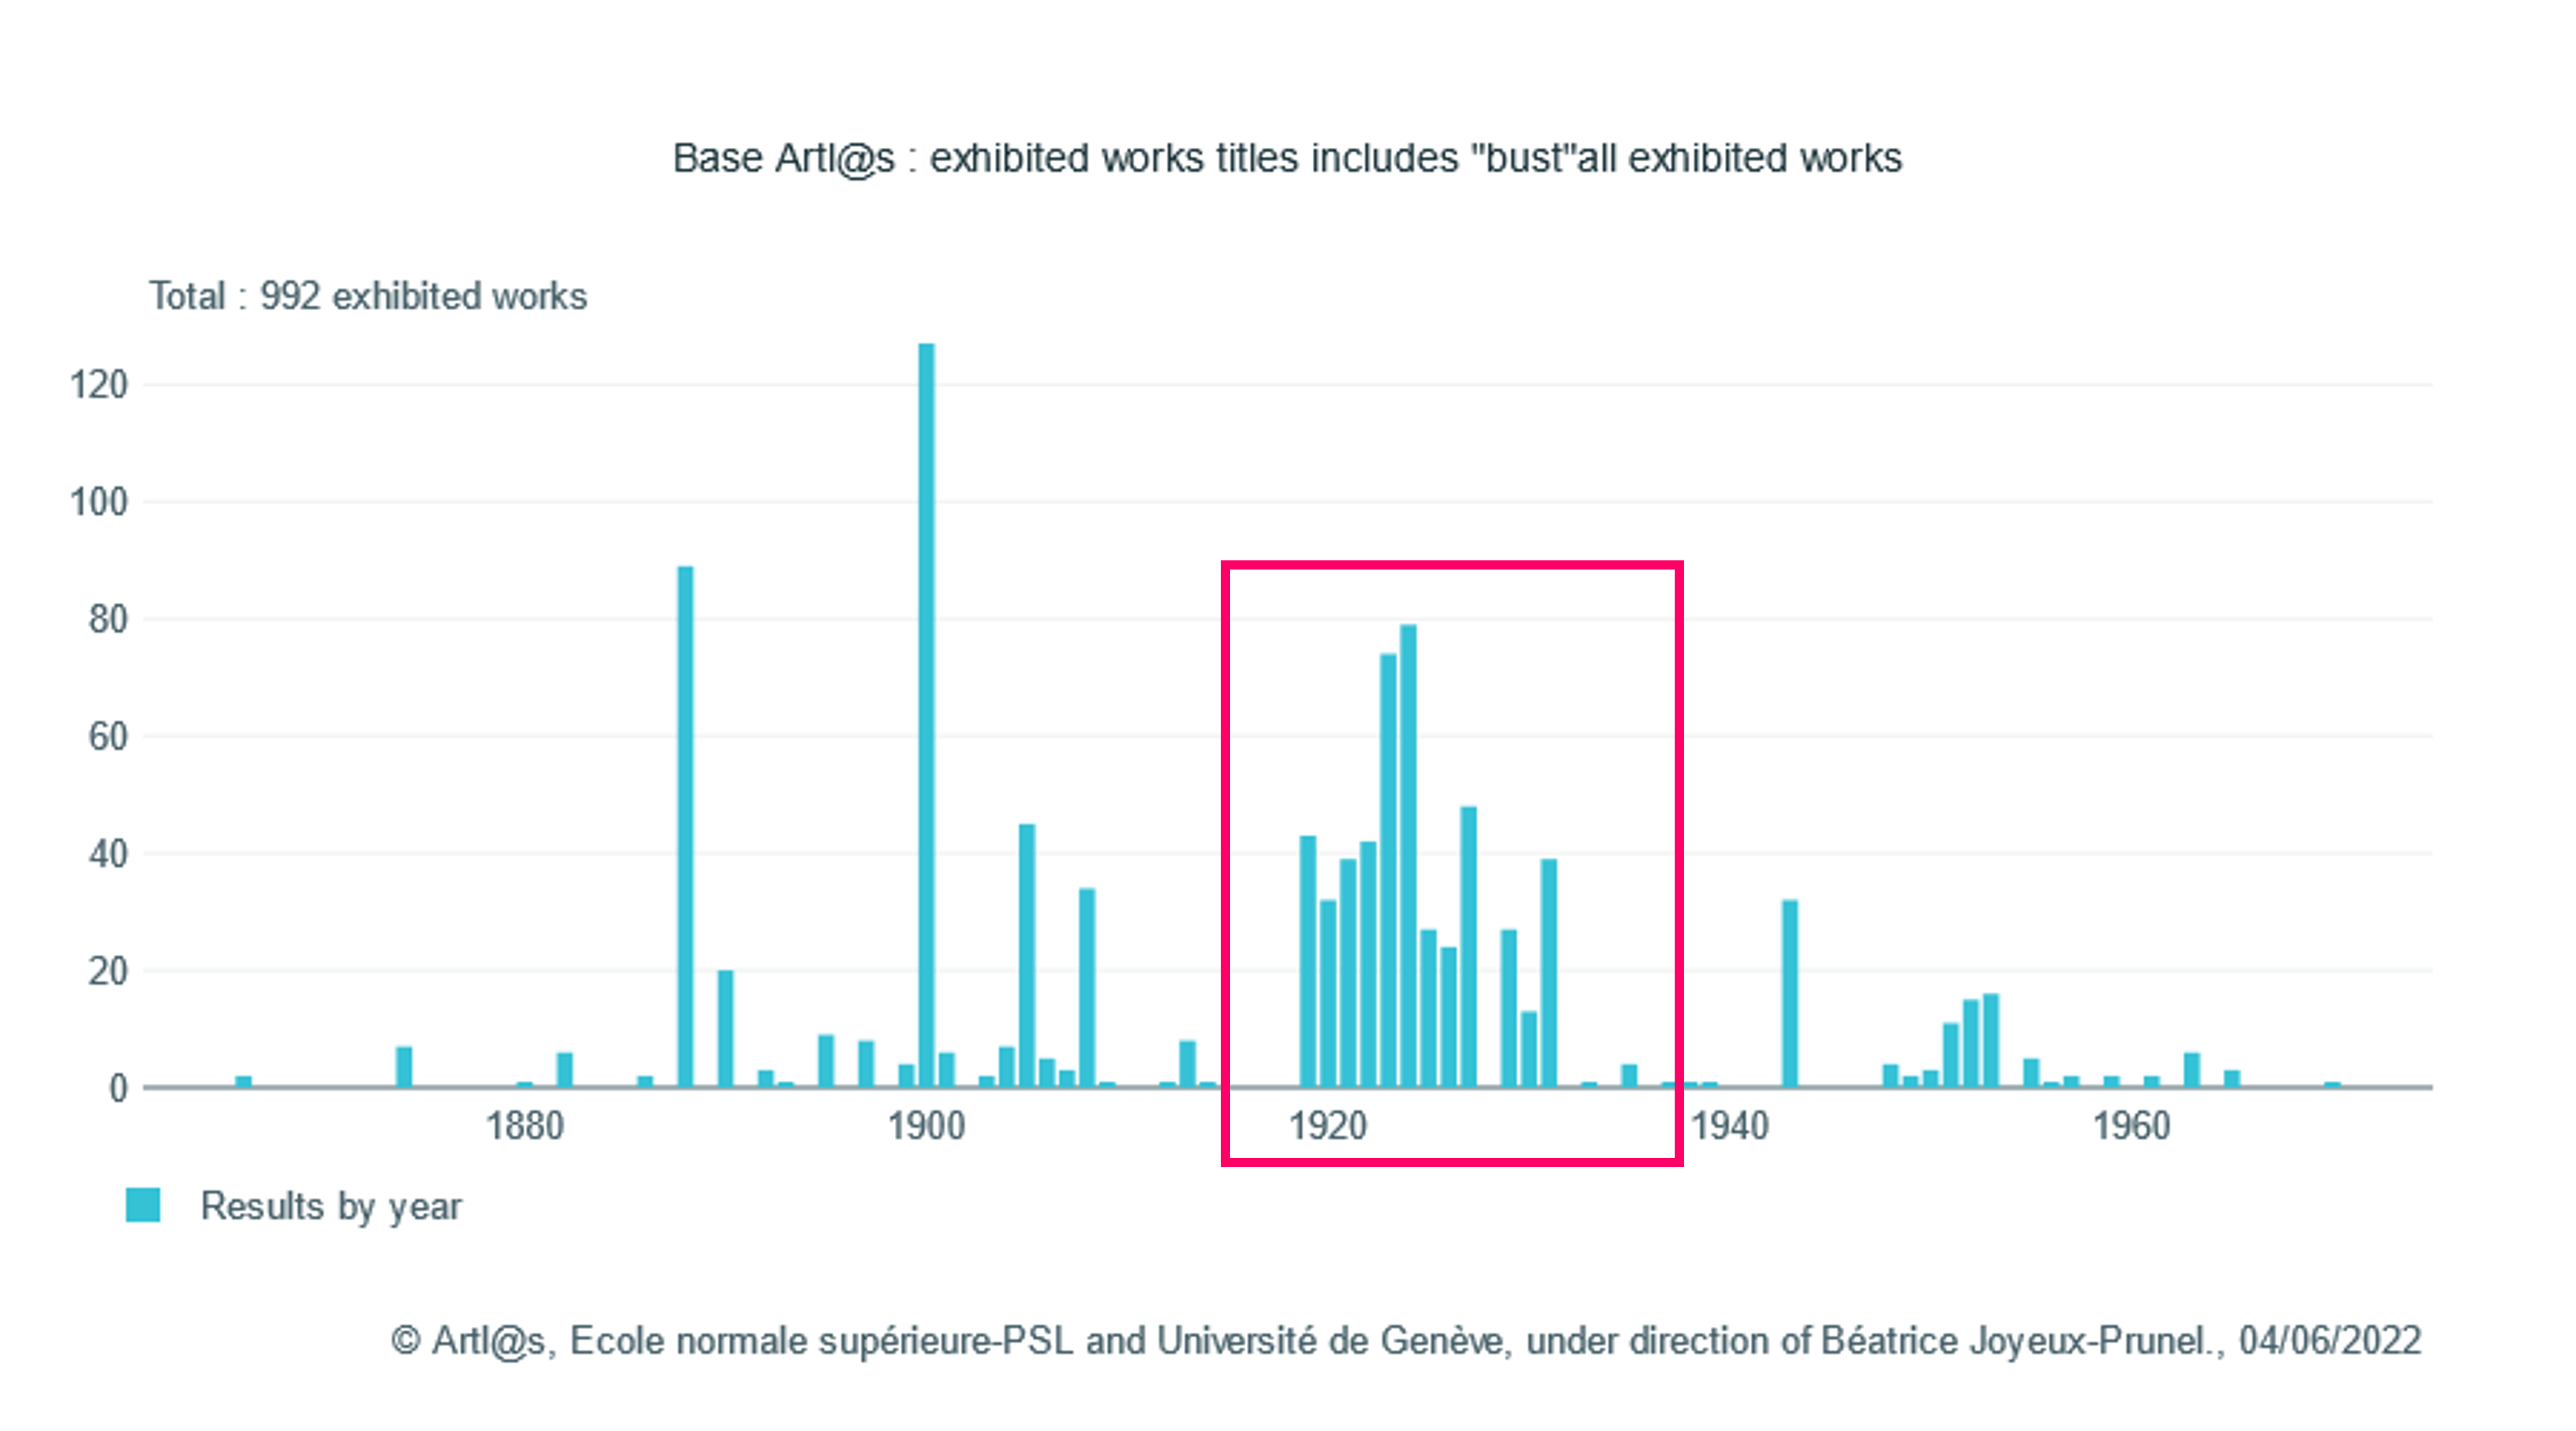
It is then up to us to analyze in more detail how the bust constituted or not a fashion in which circles in the 1920s, from well-chosen case studies, themselves enlightened by the comments of the observers of the time - which will be done below.
But what are the other possible forms of the epidemic curve?
Continuous common source
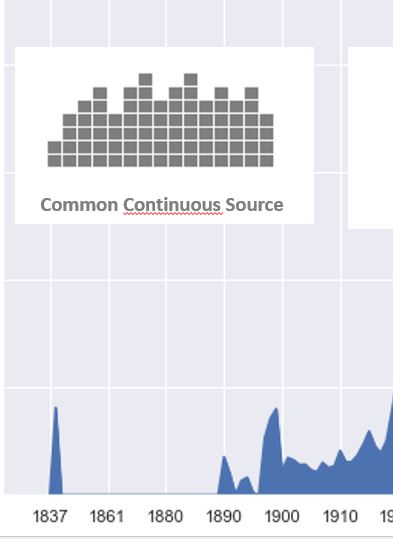
When the curve shows several peaks, epidemiologists speak of a common continuous source epidemic. Individuals are exposed to the virus over a relatively long period of time (for example, in the case of contamination of a well whose water is consumed by a neighborhood).
For busts, we find this curve shape from the 1890s to the 1910s. Making busts, talking about them and reproducing them in the press seems to have been a fairly regular phenomenon during this period, before the great fashion of the 1920s. The small peaks of 1890 and 1900 are also reflected in the exhibition catalogs of the Artl@s project (see graph above).
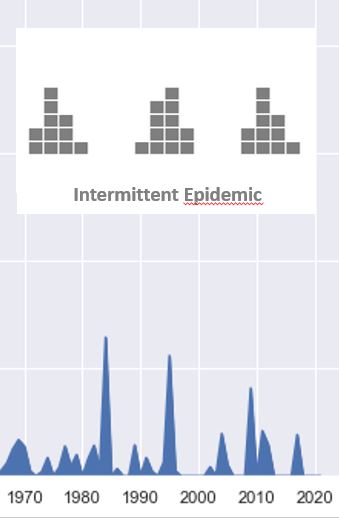
Intermittent epidemic
Finally, when peaks appear regularly, one can think of an intermittent epidemic, whose crises are unrelated to each other. An example is when contaminated food is sold and then withdrawn from sale. In the case of the busts, this seems to happen in the second half of the 20th century.
Micro scale
It is at the scale of the particular case that we can better understand whether an image is circulating in an epidemic way or not, once the first hypotheticals drawn from the macroscopic approach have been verified. The context in which the image circulates is essential in this respect.
In the case of busts, we have already seen how the press and caricature approach fashion, from apprenticeship in sculpture workshops to the desire for immortality of the European elites. It would also be useful to study in depth certain cases - the presence of images of busts in a particular magazine, which would observe the type of comments associated with this fashion in the texts that the images in question illustrate; the reproduction of busts of the same artist in different magazines, possibly in association with the analysis of the archives of the artist in question, if they are available, and allow a better understanding of how certain busts were chosen to be photographed and then reproduced, and on what occasion they were reproduced; the archives of a particular dealer who offered busts to his clients, and perhaps asked for them from his artists, etc. No epidemic study can be satisfied with a single dimension. It is often by going from one to the other that the most interesting ideas come to light.
But then we are already in another stage - the one that wants to describe the epidemic, its places and its speed of spread, and then the one that tries to explain how the contagion spreads.
Read More :
1. Characterize. Is a circulation of images necessarily epidemic?
2. Describe. Where, when and how fast? How?
3. Explain. Are there laws of imitation for images?
4. Experiment.
Chapter